
In our last article, we discussed the four best time series databases available in 2019.
When storing data in a time series database, you often want to visualize and analyze it to have a clearer idea of trends, seasonalities or sudden changes that may be anomalies.
This is when the open source dashboard monitoring tools come into play.
Open source dashboard monitoring tools are designed to provide powerful visualizations to a wide variety of datasources. Often linked with time series databases, they can also be linked with regular relational databases.
In this article, we are going to focus on the 4 best open source dashboard monitoring tools in 2019. We will discuss what their qualities are, the industries they are linked to and how they differ from each other.
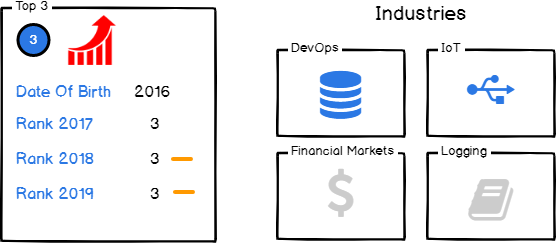
I – Grafana
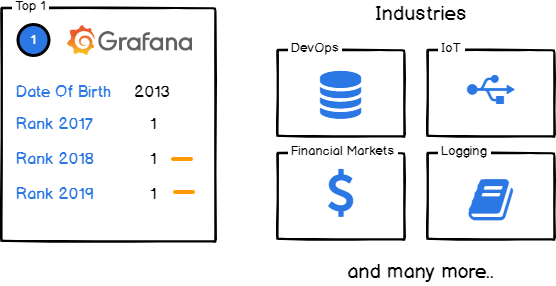
Grafana is by far one of the most popular dashboard monitoring systems in use.
Released in 2013 and developed by Grafana Labs, Grafana plugs to a wide variety of data sources and provides a ton of panels to visualize your data.
One of the most common usage of Grafana is plugging to time series databases in order to visualize data in real time. For certain panels, Grafana is equipped with an alerting system that allows users to build custom alerts when certain events occur on your data.
Gauges, world maps, tables and even heatmaps are concrete examples of panels that you are going to find in Grafana.
New panels are released very frequently : as we write this article, Grafana just announced v6.2 that is shipping the brand new bar gauge panel.
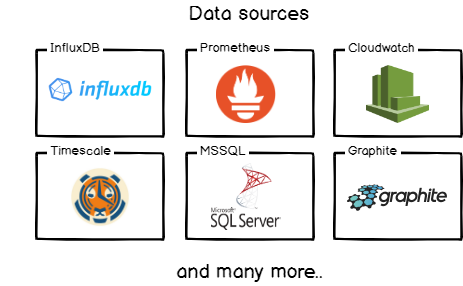
As described previously, Grafana plugs to many different datasources : InfluxDB or Prometheus are examples of time series databases available ; for relational databases, you can easily plug to MySQL or PostgresQL databases (or TimescaleDB). Indexes are also available via the ElasticSearch connector.
In my opinion, Grafana remains a reference for open source dashboard monitoring. Their latest additions (such as the ‘Explore’ function or the new panels) emphasizes their ambition to bring a global tool for monitoring, alerting and analyzing data.
For curious developers, you can check Torkel Ödegaard’s great talk at GrafanaCon 2019 where he described Grafana’s roadmap and future projects.
II – Chronograf
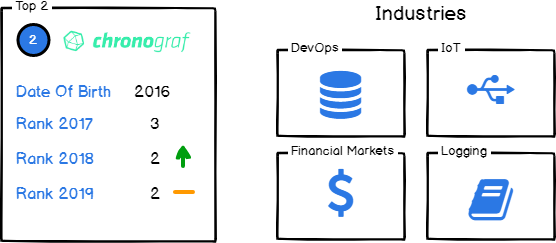
Developed by InfluxData for many years, Chronograf is a solid alternative to Grafana when it comes to visualizing and exploring your data for InfluxDB data sources.
Chronograf exposes similar panels but there is one major difference with Grafana : Chronograf really focuses on exploring, querying and visualizing data using InfluxQL and the Flux language. If you’re not familiar with what the Flux language is, you can check the article that I wrote that unveils the different capabilities of this new programming language.
So should you use Grafana or Chronograf?
In the end, it all comes down to your needs.
If you’re dealing a lot with InfluxDB in your infrastructure, then you should use Chronograf as it is specifically designed to handle InfluxDB databases.
On the other hand, if you have a variety of data sources, you should use Grafana. Those tools have similar abilities but Chronograf is more Influx-centered than Grafana.
As Tim Hall mentioned in his “Chronograf – Present & Future” talk in InfluxDays 2018: the answer is to try both!
The UI aspect of Chronograf is very decent and modern : I think that you should try it at least once if you’re dealing with InfluxDB databases.
Would you link to see what a Chronograf dashboard look like? Head over to my ‘Monitoring systemd services in real-time using Chronograf‘ article!
III – Netdata
Netdata is a tool that tracks performance and monitors health for a wide panel of system and applications.
Netdata is configuration-based and runs as a daemon on the target machine.
Furthermore, Netdata is plugin-based.
When defining your daemon, you can choose from a panel of plugins that are either internal or external.
When you are set, there are two ways for you to retrieve and visualize data:
- “Pull” method : you can set Netdata to run on individual nodes and plug your dashboards directly to it. This way, you can scale your node to your needs and you are not concerned about the scaling of different nodes. Also, storage is scoped to what’s really needed by a particular node thus more efficient;
- “Push” method : similarly to what you would find in Prometheus with Pushgateway, you can ‘push’ metrics to a centralized place. You may find this handy for jobs that have a small lifespan such as batch jobs.
With Netdata, you can easily configure streaming pipelines for your data and replication databases.
This way, you can scale slave nodes depending on your needs and adapt to the actual demand.
Netdata’s website is available here : https://my-netdata.io/
If you’re more into video tutorials, Lawrence Systems made a pretty decent video about it.
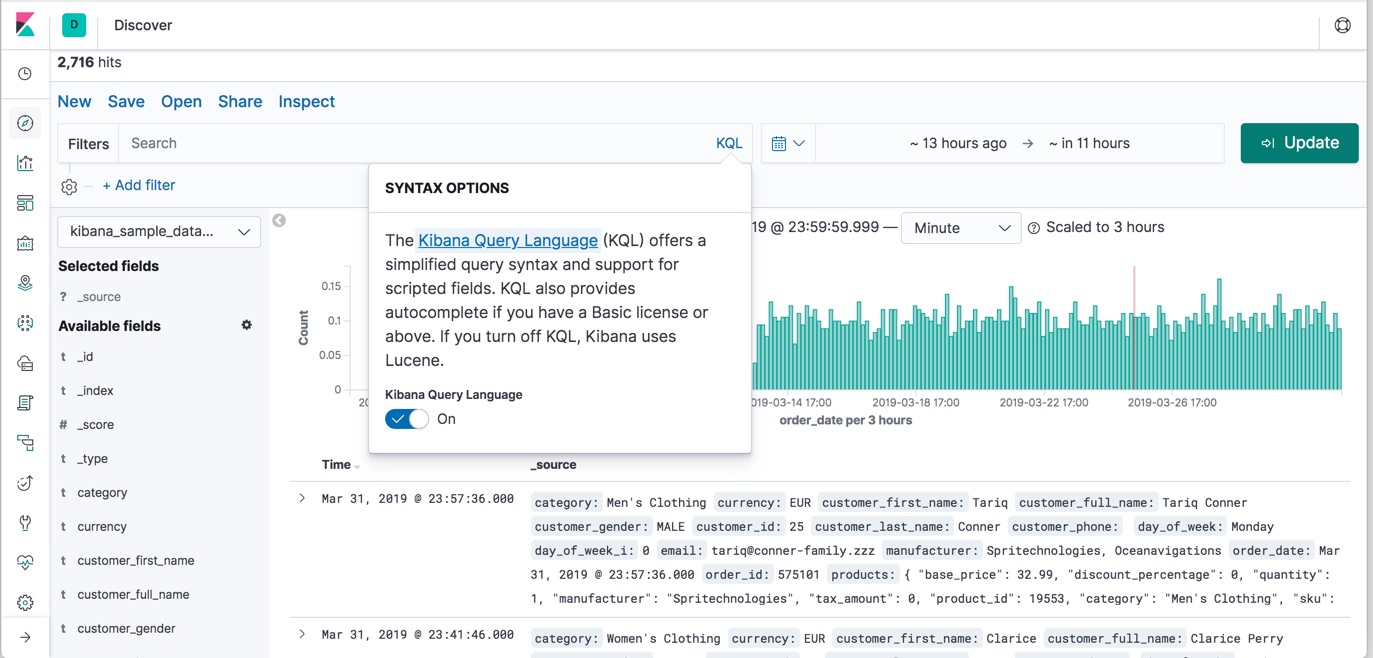
IV – Kibana
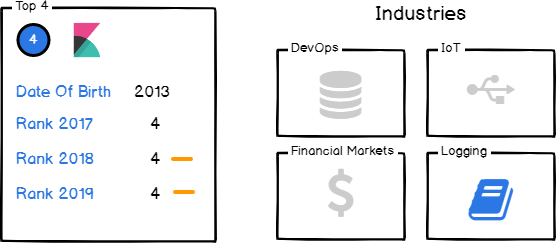
Any dashboard monitoring ranking wouldn’t be complete without mentioning Kibana.
Kibana is part of Elastic’s product suite and is often used in what we call an ELK stack : ElasticSearch + Logstash + Kibana.
You probably know ElasticSearch, the search engine based on the Lucene language.
If you’re unfamiliar with Elastic products, ElasticSearch provides a REST-based search engine that makes it fast and easy to retrieve data. It is often used in companies that are looking to speed-up their data retrieval processes by providing fast interfaces to their end users.
Logstash can be defined as a log pipeline. Similarly to rsyslog, you can bind it to an extensive list of datasources (AWS, databases, or stream pipelines such as Kafka). Logstash will collect, transform data and insert it into ElasticSearch. Finally, Kibana will be used to visualize data stored in ElasticSearch.
https://www.elastic.co/fr/blog/kibana-7-0-0-released
As you guessed it, Kibana is suited for log monitoring and has nothing to do with direct network or DevOps monitoring (even if you could store log related to servers or virtual machines!)
X – Wraping Up
Now that you have an idea of the best dashboard monitoring tools right now, how do you plan on adding them to your company tech stack?
If you are already using those tools, what were you able to accomplish with them? How did they specifically add value to your business?
Thank you for reading this article, I hope that you found it insightful.
Until then, have fun, as always.