
The RAM, for Random Access Memory, is a critical component of a Linux system that needs to be monitored closely.
In some cases, you might run out of memory, leaving your server with very slow response times or being completely unresponsive.
As a consequence, knowing how to check your RAM on Linux is crucial because you might be able to take preventive actions instead of corrective ones.
You might also want to increase your swap memory, also known as virtual memory, in order to enhance the performance of your server.
In this tutorial, we are going to list all the ways to check your RAM on Linux.
Check RAM on Linux using free
The most popular command in order to check your RAM on Linux is to use the “free” command.
$ free
              total        used        free      shared  buff/cache   available
Mem:        4039588     3475216      137584       39596      426788      287580
Swap:             0           0           0
As you can see, the output is divided into two categories : memory (the actual RAM) and swap (also called virtual memory).
By using free, you are provided with the following information :
- total : the total amount of memory that is currently installed on your system in kilobytes;
- used : the amount of RAM currently used on your system in kilobytes;
- free : the amount of free memory available on your system in kilobytes;
- shared : represents the memory used by tmpfs which is a virtual filesystem that appears to be mounted but belongs to volatile memory;
- buffers : memory used by the kernel buffers;
- cache : the number of memory used by the page cache where data might be stored first before being written to disk;
- available : the memory available on the system in kilobytes
Note that even if a lot of memory might be used by the cache or by the buffers, the Kernel may free this space if your system requires more memory for processes.
As the lsblk command that we discovered in our disk tutorials, the “free “command can be displayed in a human-friendly format.
To check the current RAM available using a human friendly format, use “free” with the “-h” option.
              total        used        free      shared  buff/cache   available
Mem:           3.9G        3.3G        127M         38M        400M        256M
Swap:            0B          0B          0B
As you can see, the output is easier to read but it is rounded.
Similarly, with the free command you are able to have total columns displayed in order to check the total amount of RAM and swap available on your system.
To show total columns, use “free” with the “-t” option.
$ free -t
              total        used        free      shared  buff/cache   available
Mem:        4039588     3499392      128828       39596      411368      263292
Swap:             0           0           0
Total:      4039588     3499392      128828
Note that the commands can be combined in order to have a human friendly output and to have the total columns displayed.
$ free -th
              total        used        free      shared  buff/cache   available
Mem:           3.9G        3.3G        125M         38M        402M        257M
Swap:            0B          0B          0B
Total:         3.9G        3.3G        125M
Check RAM using vmstat
Another great way to check your current virtual memory usage is to use the “vmstat” command.
$ vmstat
procs -----------memory---------- ---swap-- -----io---- -system-- ------cpu-----
 r  b   swpd   free   buff  cache   si   so    bi    bo   in   cs us sy id wa st
 1  0      0 149720  49080 371348    0    0   125   121    1    1  2  1 96  0  0
The output might be a bit hard to read but here are the details of the columns displayed :
- r : number of runnable processes on your system;
- b : number of processes in uninterruptible sleep;
- swpd : the amount of RAM currently used by your system;
- free : the memory available
- buff, cache : the RAM used by the kernel buffers and by the page caches;
- inactive, active : the amount of inactive and active memory
- si : the swap used from the disk
- so : the swap memory swapped to the disk
The other columns are related to disk I/O and to the CPU usage which might not be relevant in our case.
$ vmstat -s
      4039588 K total memory
      3460532 K used memory
      3398428 K active memory
       198356 K inactive memory
       162648 K free memory
        48904 K buffer memory
       367504 K swap cache
            0 K total swap
            0 K used swap
            0 K free swap
As you can see, you are provided with a large number of line outputs but only a few are relevant to what we are trying to achieve.
At the top of the vmstat output, you can see the total memory, the used memory, the active memory (which is equivalent to the used memory), the inactive and the free memory.
Those columns are very similar to the columns displayed using the free command.
You are also provided with the buffer memory, the swap cache (which is equivalent to the page cache) as well as the total swap if any.
Inspecting /proc/meminfo to check RAM
As you already know, the Kernel is the one virtualizing the filesystem and providing entry points to some of your devices on your system.
For example, the /proc directory might store references to processes on your system (i.e file descriptors) ; similarly the /dev will store references to virtual devices that in the end point to real disks.
However, one file of the /proc file might be more important than others when it comes to checking your RAM : meminfo.
$ cat /proc/meminfo

MemTotal:        4039588 kB
MemFree:          142400 kB
MemAvailable:     267144 kB
Buffers:           39216 kB
Cached:           292508 kB
SwapCached:            0 kB
Active:          3436724 kB
Inactive:         180432 kB
Active(anon):    3285468 kB
Inactive(anon):    38960 kB
Active(file):     151256 kB
Inactive(file):   141472 kB
Unevictable:          36 kB
Mlocked:              36 kB
SwapTotal:             0 kB
SwapFree:              0 kB
Dirty:               708 kB
As you can see, the Kernel is providing you with statistics close to the ones displayed in the “free” or “vmstat” command.
That is actually not a big surprise because those commands are actually getting their information from the meminfo file itself.
Using the /proc/meminfo file, you have access to the total amount of memory of your system, the free memory available, the memory available as well as buffers and page caches that may be used.
Finally, you have access to the swap cache as well as the active and inactive swap used.
Listing RAM hardware using dmidecode
All the commands used before are very helpful, but they can only be used in order to check the RAM used at a given point in time.
In some cases, you might be interested in knowing more about your RAM hardware.
To do that, you have to use the dmidecode command.
Warning : you might have to be sudo in order to run dmidecode on your system.
$ sudo dmidecode

# dmidecode 3.1
Getting SMBIOS data from sysfs.
SMBIOS 2.4 present.
13 structures occupying 405 bytes.
Table at 0x000F10D0.

Handle 0x0000, DMI type 0, 24 bytes
BIOS Information
        Vendor: Private
        Version: 20171212
        Release Date: 12/12/2017
        Address: 0xE8000
        Runtime Size: 96 kB
        ROM Size: 64 kB
        Characteristics:
                BIOS characteristics not supported
                Targeted content distribution is supported
        BIOS Revision: 1.0
By default, the dmidecode is used in order to perform a dump of all the hardware used on your system.
In order to get the hardware dedicated to your memory, you have to specify the type of hardware used.
$ sudo dmidecode --type memory

# dmidecode 3.1
Getting SMBIOS data from sysfs.
SMBIOS 2.4 present.

Handle 0x1000, DMI type 16, 15 bytes
Physical Memory Array
        Location: Other
        Use: System Memory
        Error Correction Type: Multi-bit ECC
        Maximum Capacity: 4 GB
        Error Information Handle: Not Provided
        Number Of Devices: 1

Handle 0x1100, DMI type 17, 21 bytes
Memory Device
        Array Handle: 0x1000
        Error Information Handle: 0x0000
        Total Width: 64 bits
        Data Width: 64 bits
        Size: 4096 MB
        Form Factor: DIMM
        Set: None
        Locator: DIMM 0
        Bank Locator: Not Specified
        Type: RAM
        Type Detail: None
As you can see, the dmidecode output is pretty useful : with it you can know more about the maximum capacity of your system and how it is distributed.
In this example, my system is equipped with 4 GB of total memory provided by one single RAM located in the DIMM 0 memory space.
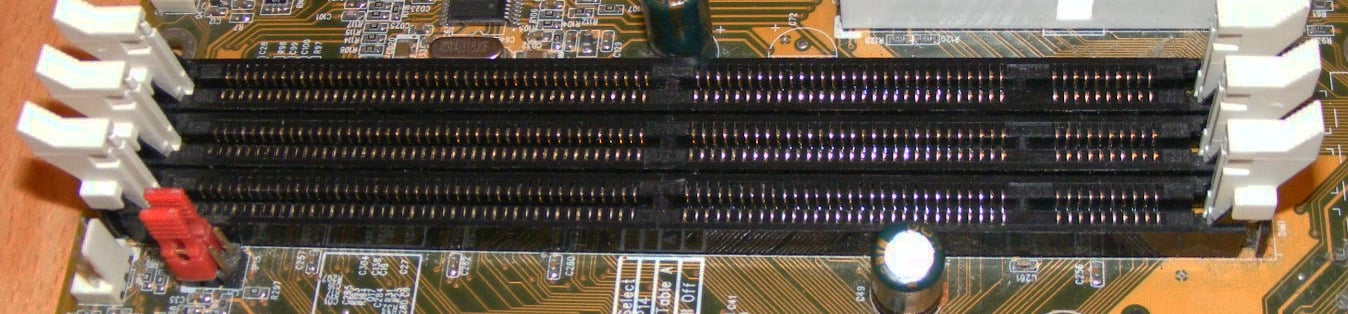
Using the picture provided here, the RAM memory would have been introduced in the first slot available (DIMM 0)
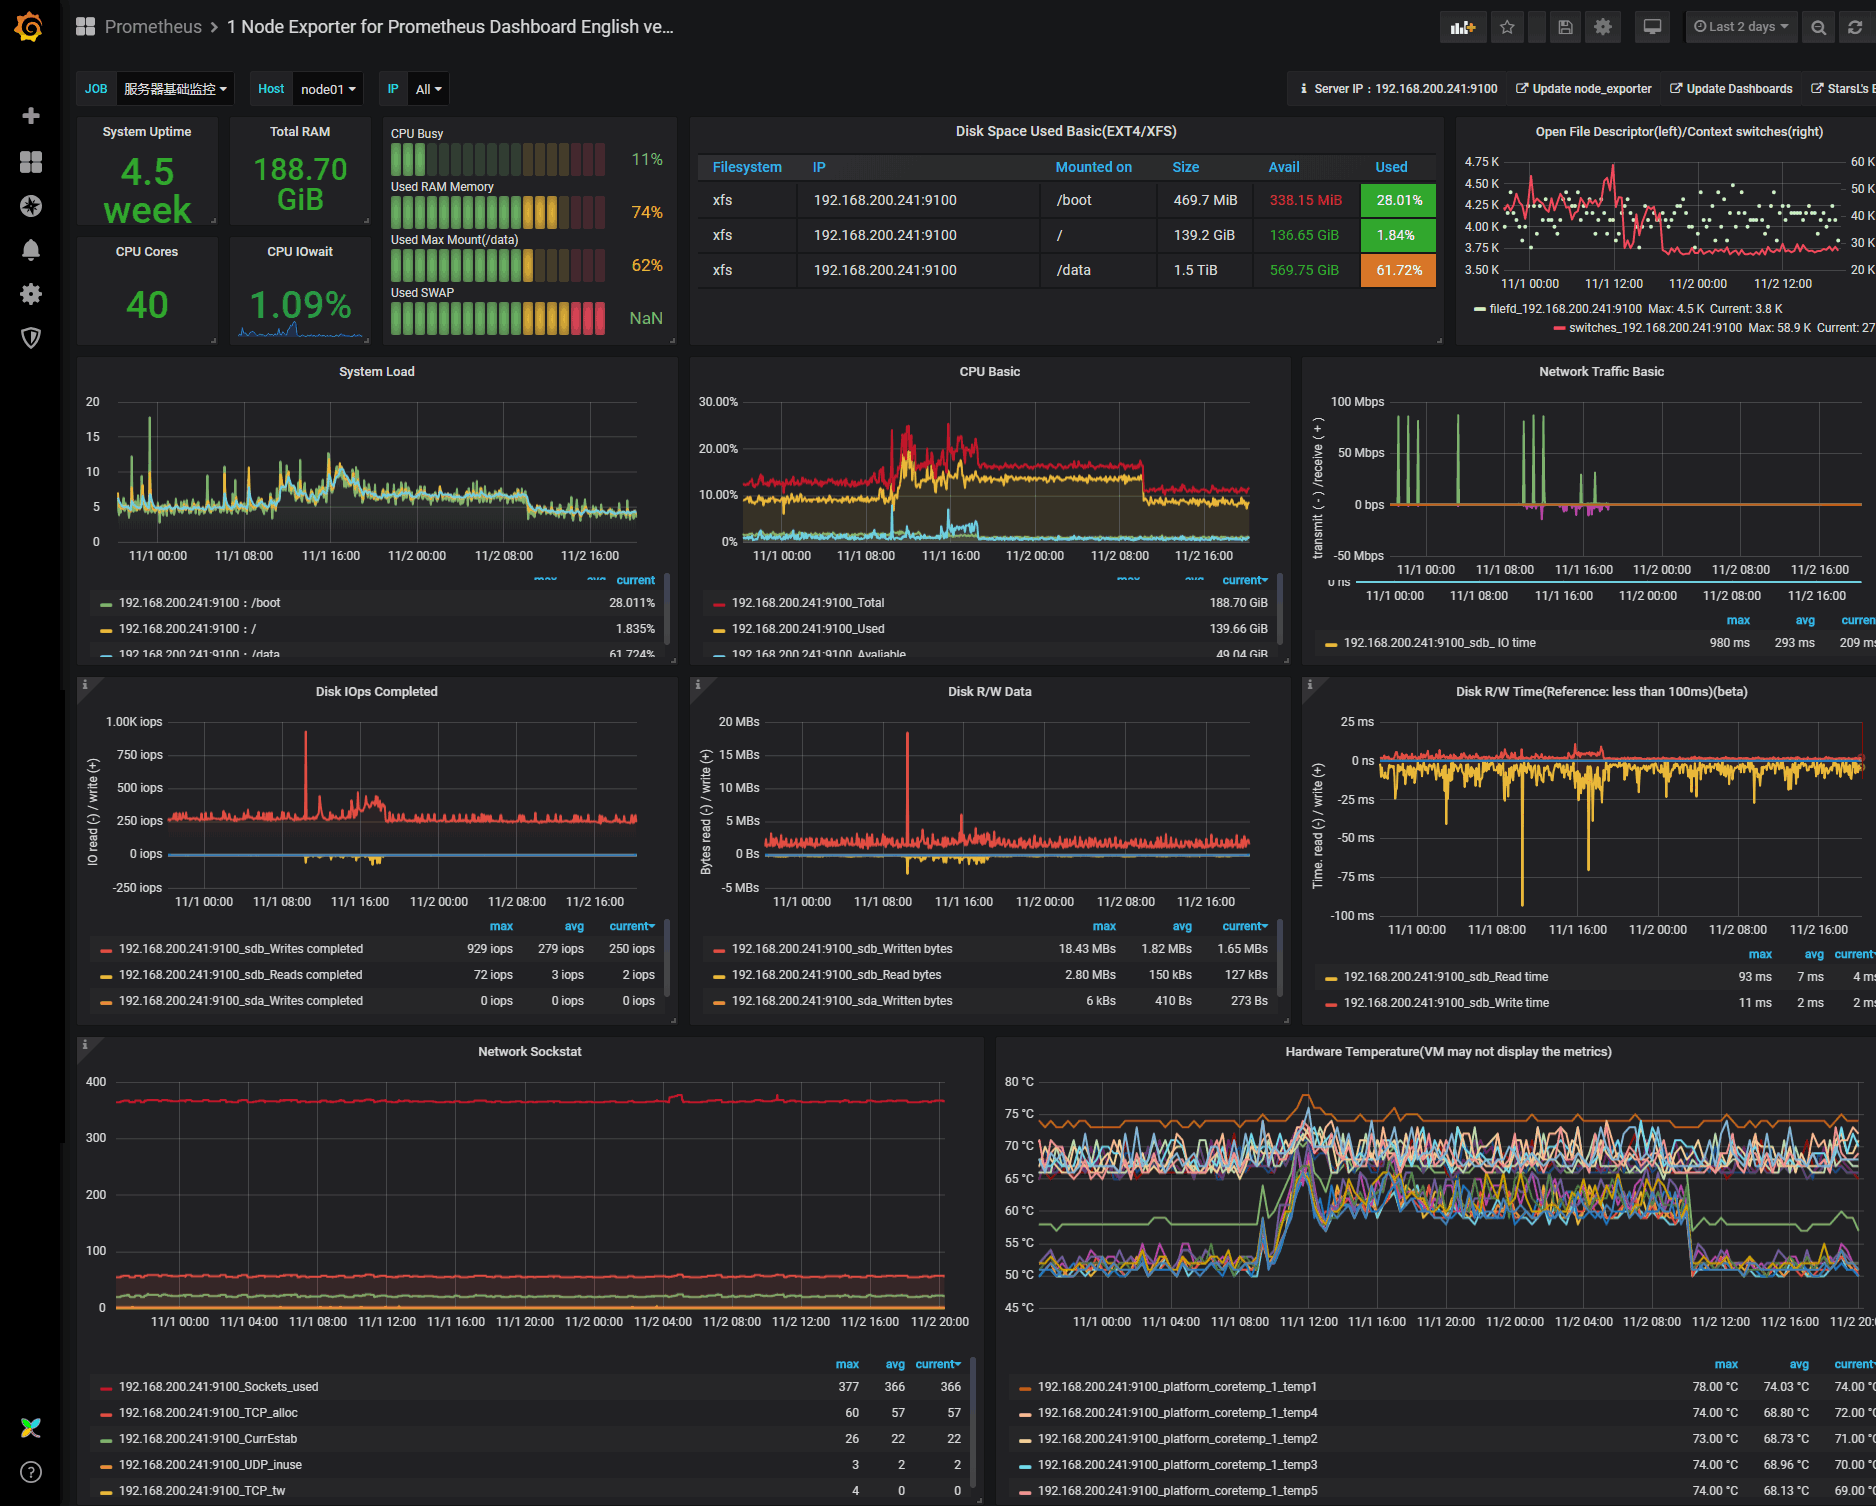
Check RAM usage using Prometheus
The methods described above work very well, but they are a bit old-fashioned compared to modern monitoring solutions.
One great way to track your RAM usage is to use a modern monitoring stack such as Prometheus & Grafana.
Prometheus exposes a Node Exporter that can be used in order to gather host metrics in particular memory metrics.
Checking on the Node Exporter Github page, you will have to activate the “meminfo” collector that is specialized in gathering memory metrics from the /proc/meminfo file.
From there, you can easily import an existing dashboard into Grafana in order to have real time memory statistics about your system.
Checking the Node Exporter tutorial we linked before should get your to the same output, you can choose the Grafana dashboard of your choice here.
Track RAM usage using top/htop commands
Finally, you might find useful to use the top and htop interactive commands in order to track your memory usage.
Top is natively installed on your system, simply run “top” in order to get the statistics about your system.
$ top

top - 12:16:27 up 306 days,  7:11,  2 users,  load average: 0.00, 0.00, 0.00
Tasks: 256 total,   1 running, 214 sleeping,   0 stopped,   0 zombie
%Cpu(s):  1.3 us,  0.7 sy,  0.0 ni, 97.8 id,  0.2 wa,  0.0 hi,  0.0 si,  0.0 st
KiB Mem :  4039588 total,   314884 free,  3436960 used,   287744 buff/cache
KiB Swap:        0 total,        0 free,        0 used.   325952 avail Mem

  PID USER      PR  NI    VIRT    RES    SHR S  %CPU %MEM     TIME+ COMMAND
23616 telegraf  20   0 1201168  19808   4944 S   1.3  0.5   1051:02 telegraf
23120 influxdb  20   0 2043020 250208   9956 S   0.7  6.2 715:58.34 influxd
 3688 root      20   0 1031632  43296      0 S   0.3  1.1 497:27.81 mongod
As you can see here, you are provided with CPU statistics but also with the total amount of RAM and swap used by your system.
You are also given the available amounts as well as the buffer and page caches used.
Statistics are given for your complete system but they are also provided for every single process on your instance sorted from top to bottom.
The htop command can also be effectively used in order to provide a human-friendly memory tracking on your server.
The htop might not be natively installed on your system, so you might have to install it.
$ sudo apt-get install htop
$ sudo yum install htop
When htop is installed, you can start running it by executing “htop”
$ htop


  1  [|                                        2.0%]   Tasks: 192, 608 thr; 1 running
  2  [|                                        0.7%]   Load average: 0.16 0.07 0.02
  Mem[||||||||||||||||||||||||||||||||||3.32G/3.85G]   Uptime: 306 days(!), 07:16:02
  Swp[                                        0K/0K]

  PID USER      PRI  NI  VIRT   RES   SHR S CPU% MEM%   TIME+  Command
29728 user      20   0 26336  4520  3148 R  1.3  0.1  0:01.11 htop                                           328872 logstash   39  19 3679M  721M     0 S  0.7 18.3 11h58:46 /usr/bin/java -Xms1g -Xmx1g -
As you can see, the outputs are pretty similar : they are just made easier to read.
Conclusion
In this tutorial, you learnt about the many different ways to check your RAM on Linux using either the command-line or modern monitoring solutions such as Prometheus and Grafana.
If you need to improve memory management on your system, you should definitely check tutorials related to swap as they elaborate more about the importance of virtual memory on your system.
If you are interested in Linux system administration, make sure to have a look at other tutorials that we have on the subject.

2 comments
[…] How To Check RAM on Linux […]
Thanks alot very nice explanation