
Monitoring disk I/O on a Linux system is crucial for every system administrator.
When performing basic system troubleshooting, you want to have a complete overview of every single metric on your system : CPU, memory but more importantly a great view over the disk I/O usage.
In our previous tutorial, we built a complete Grafana dashboard in order to monitor CPU and memory usages.
In this tutorial, we are going to build another dashboard that monitors the disk I/O usage on our Linux system, as well as filesystems and even inodes usage.
We are going to use Prometheus to track those metrics, but we will see that it is not the only way to do it on a Linux system.
This tutorial is split into three parts, each providing a step towards a complete understanding of our subject.
- First, we will see how disk I/O monitoring can be done on a Linux system, from the filesystem itself (yes metrics are natively on your machine!) or from external tools such as iotop or iostat;
- Then, we will see how Prometheus can help us monitoring our disk usage with the Node exporter. We are going to set up the tools, set them as services and run them;
- Finally, we are going to setup a quick Grafana dashboard in order to monitor the metrics we gathered before.
Ready?
Lesson 1 – Disk I/O Basics
(If you came only for Prometheus & the Node Exporter, head over to the next section!)
On Linux systems, disk I/O metrics can be monitored from reading a few files on your filesystem.
Remember the old adage : “On Linux, everything is a file“?
Well it could not be more true!
If your disks or processes are files, there are files that store the metrics associated to it at a given point in time.
A complete procfs tour
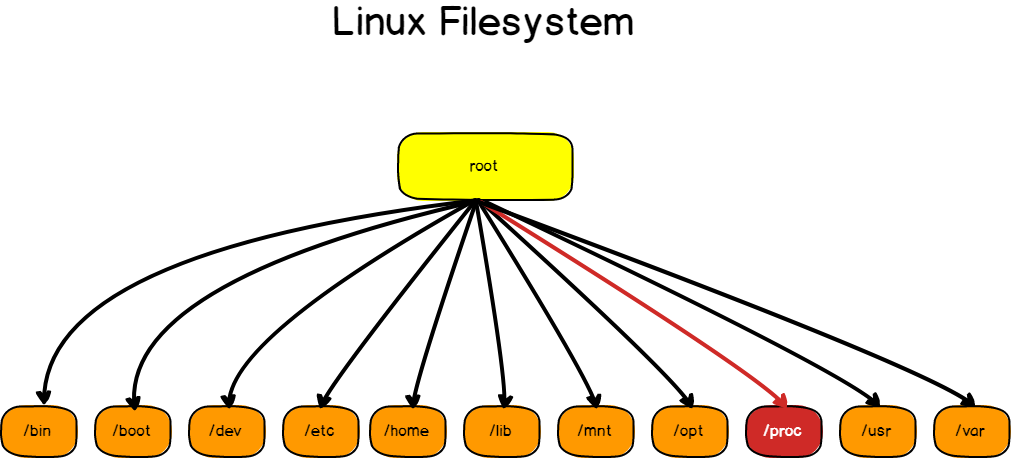
As you already know it, Linux filesystems are organized from a root point (also called “root”), each spawning multiple directories, serving a very different purpose for a system.
One of them is /proc, also called procfs. It is a virtual filesystem, created on the fly by your system, that stores files related all the processes that are running on your instance.
The procfs can provide overall CPU, memory and disk information via various files located directly on /proc :
- cpuinfo: provides overall CPU information such as the technical characteristics of your current CPU hardware;
- meminfo: provides real time information about the current memory utilization on your system;
- stat: gathers real time metrics on CPU usage, which is an extension of what cpuinfo may provide already.
- /{pid}/io: aggregates real time IO usage for a given process on your system. This is very powerful when you want to monitor certain processes on your system and how they are behaving over time.
> sudo cat /proc/cpuinfo
dev@dev-ubuntu:/proc$ sudo cat cpuinfo
processor       : 0
vendor_id       : GenuineIntel
cpu family      : 6
model           : 79
model name      : Intel(R) Xeon(R) CPU E5-2650 v4 @ 2.20GHz
As you guessed it, Linux already exposes a set of built-in metrics for you to have an idea of what’s happening on your system.
But inspecting files directly isn’t very practical. That’s why we will have a tour of the different interactive tools that every sysadmin can use in order to monitor performances quickly.
5 Interactive Shell Utilities for Disk I/O
Practically, a sysadmin rarely inspects files on the proc filesystem, it uses a set of shell utilities that were designed for this purpose.
Here a list of the most popular tools used to this day :
iotop
iotop is an interactive command line utility that provides real time feedback on the overall disk usage of your system. It is not included by default on Linux systems, but there are easy-to-follow resources in order to get it for your operating system : https://lintut.com/install-iotop-on-linux/
To test it and see it live, you can execute the following command:
# > sudo iotop -Po

# > sudo iotop -Po --iter 4 >> /var/log/iotop
You should now see an interactive view of all the processes (-P) that are consuming I/O resources on your system (-o).
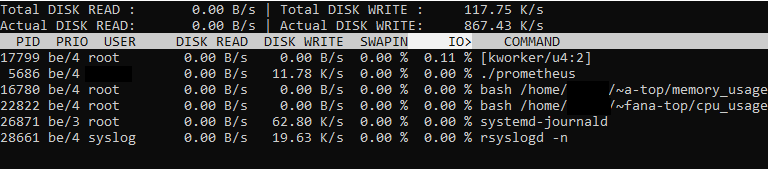
Results are pretty self explanatory : they provide the disk read usage, the disk write usage, the swap memory used as well as the current I/O used.
Handy!
The Other Contenders : iostat, glances, netdata, pt-diskstats
iotop is not the only tool to provide real time metrics for your system.
Furthermore, iotop requires sudo rights in order to be executed.
This list would probably deserve an entire article on its own, but here are alternatives that you can use to monitor your disk usage :
- iostat: features the disk usage for your devices, especially your block devices;
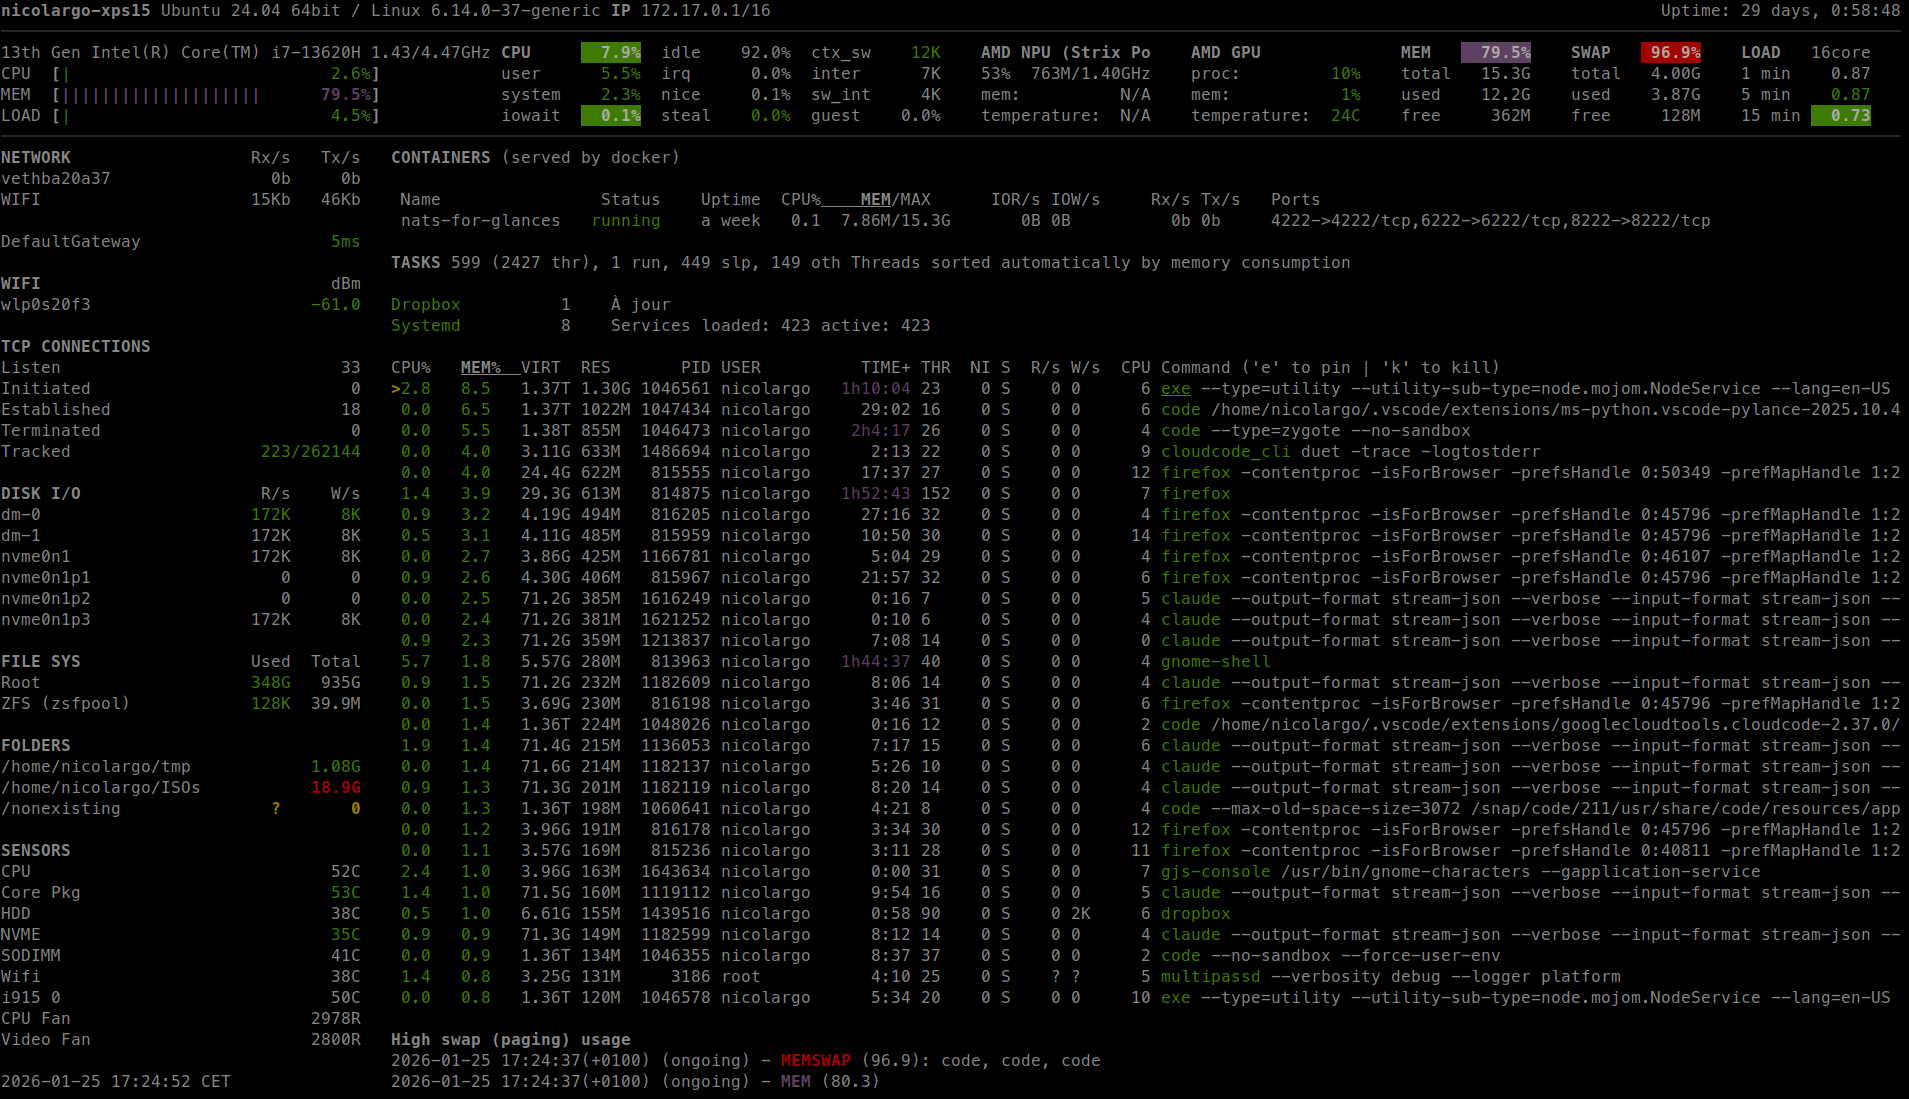
- glances: which is a cross platform system monitoring that showcases real time metrics for your entire system over an accessible Web UI;
- netdata: that was already introduced in our best dashboard monitoring solutions and that provides a plugin to access disk usage;
- pt-diskstats: built by Percona, pt-diskstats is a utility that retrieves disk usage and formats it in a way that can be easily exported and used by other external tools for analysis.
Now that you know a bit more about how you can natively monitor your disks on Linux systems, let’s build a complete monitoring pipeline with Prometheus and the Node Exporter.

Lesson 2 – Node Exporter Mastery
Besides the tools presented above, Prometheus can be one of the ways to actively monitor your disks on a Linux system.
If you not familiar with Prometheus, do not hesitate to check the definitive guide that we wrote available here.
As a quick reminder, Prometheus exposes a set of exporters that can be easily set up in order to monitor a wide variety of tools : internal tools (disks, processes), databases (MongoDB, MySQL) or tools such as Kafka or ElasticSearch.
In this case, we are going to use the Node Exporter (the github documentation is available here).
The Node Exporter is an exporter designed to monitor every single metric that you could think of on a Linux system : CPU, memory, disks, filesystems and even network tracking, that is very similar to netstat.
In our case, we are going to focus on everything that is related to disks : filesystem and global disk monitoring, represented by the filesystem and diskstats collectors.
a – Installing the Node Exporter
Prometheus installation was already explained in our previous guide, head over to this link to see how this is done.
Once Prometheus is completely set up and configured, we are going to install Node Exporter as a service on our instance.
For this installation, I am using an Ubuntu 16.04 instance with systemd.
From root, head over to the /etc/systemd/system folder and create a new node exporter service.
> cd /etc/systemd/system/
> touch node-exporter.service
Before configuring our service, let’s create a user account (prometheus) for the node exporter.
> sudo useradd -rs /bin/false prometheusMake sure that your user was correctly created. The following command should return a result.
> sudo cat /etc/passwd | grep prometheusWhen created, edit your node service as follows.
[Unit]
Description=Node Exporter
After=network.target

[Service]
User=prometheus
Group=prometheus
Type=simple
ExecStart=[path to node exporter executable]

[Install]
WantedBy=multi-user.target
Make sure that you correctly reload your system daemon and start your new service.
> sudo systemctl daemon-reload
> sudo systemctl start node-exporter

# Optional : make sure that your service is up and running.
> sudo systemctl status node-exporter
Congratulations! Your service should now be up and running.
Note : Node Exporter exposes its metrics on port 9100.
b – Set up Node Exporter as a Prometheus Target
Now that the node exporter is running on your instance, you need to configure it as a Prometheus target so that it starts scrapping it.
Head over to the location of your Prometheus configuration file and start editing it.
On the “scrape_configs” section of your configuration file, under “static_configs”, add a new target that points to the node exporter metrics endpoint (:9100 as a reminder from previous section)
scrape_configs:
  - job_name: 'prometheus'
    static_configs:
            - targets: ['localhost:9100']
Make sure to restart your Prometheus server for the changes to be taken into account.
# Service
> sudo systemctl restart prometheus
# Simple background job
> ps aux | grep prometheus
> kill -9 [pidof prometheus]
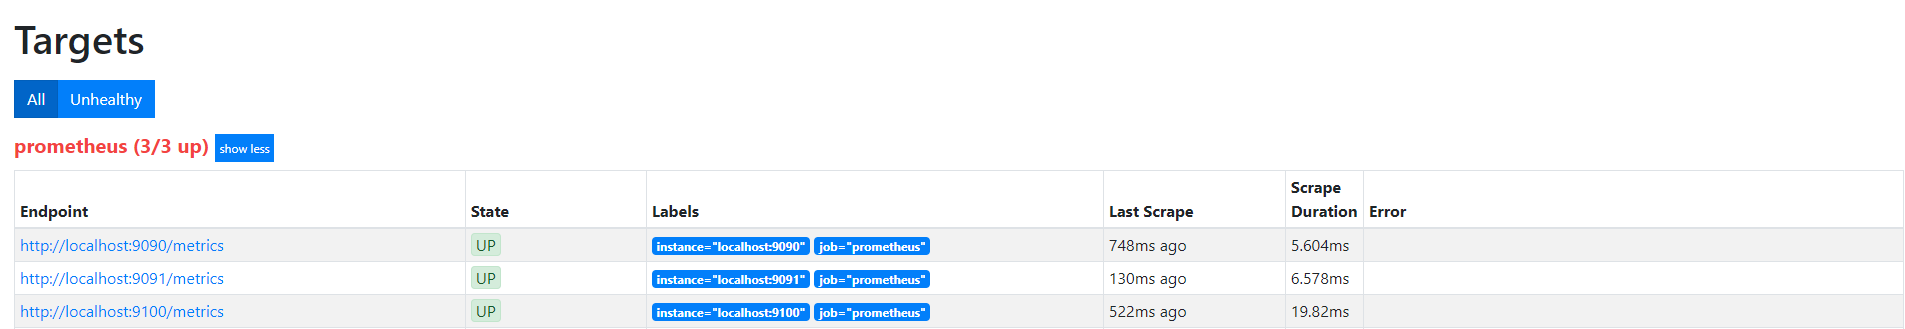
> ./prometheus &Head over to Prometheus Web UI, and make sure that your Prometheus server is correctly scrapping your node exporter.
c – Start Exploring Your Data
Now that your Prometheus server is connected to the node exporter, you will be able to explore data directly from Prometheus Web UI.
We are going to focus here on metrics related to disk usage, just to make sure that everything is set up correctly.
In the expression field, type the following PromQL query :
> irate(node_disk_read_bytes_total{device="vda"}[5s]) / 1024 / 1024As a quick explanation, this query provides a rate of the disk read operations over a period of 5 seconds, for my vda disk in megabytes per second.
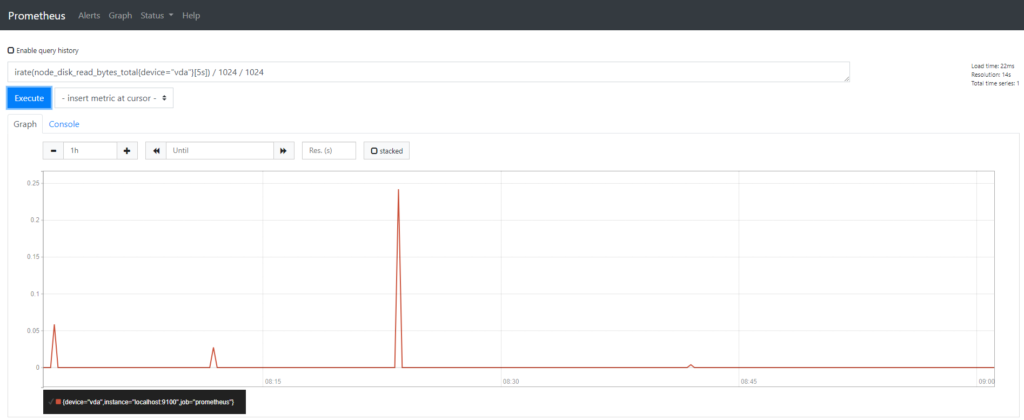
If you are able to see data in the graph, it means that everything is correctly set up.
Congratulations!

Lesson 3 – Building A Complete Disk I/O dashboard
Now that our Prometheus is storing data related to our system, it is time to build a complete monitoring dashboard for disk usage.
As a quick reminder, here’s the final look of our dashboard:
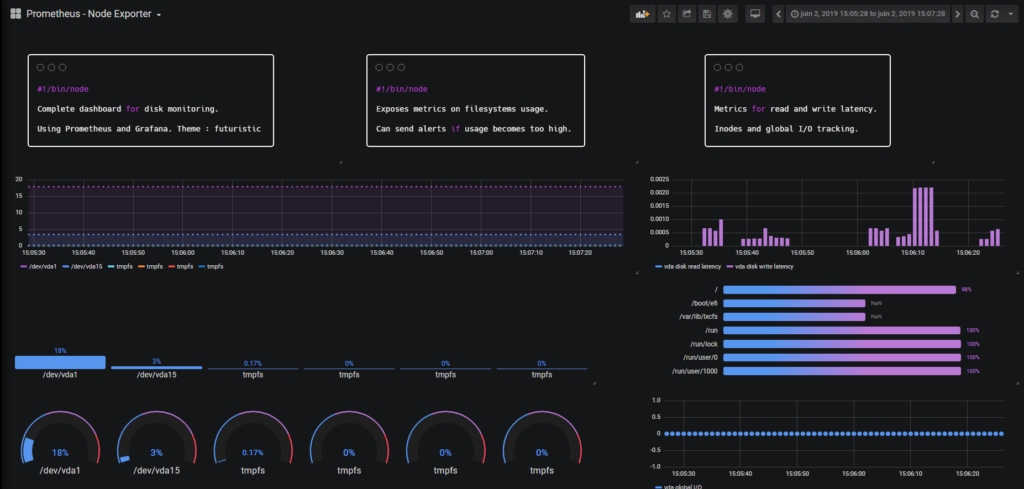
Our final dashboard is made of four different components:
- Global tracking of filesystems: given all the filesystems mounted on a given partition, we will have a complete tracking of all the space available on our filesystems;
- Write and read latency of our disks: as we have access to read and write times and the overall number of reads and write operations actually completed, we can compute latencies for both metrics;
- Check of the number of inodes available on our system;
- The overall I/O load rate in real time
As always, the different sections have been split so make sure to go directly to the section you are interested in.
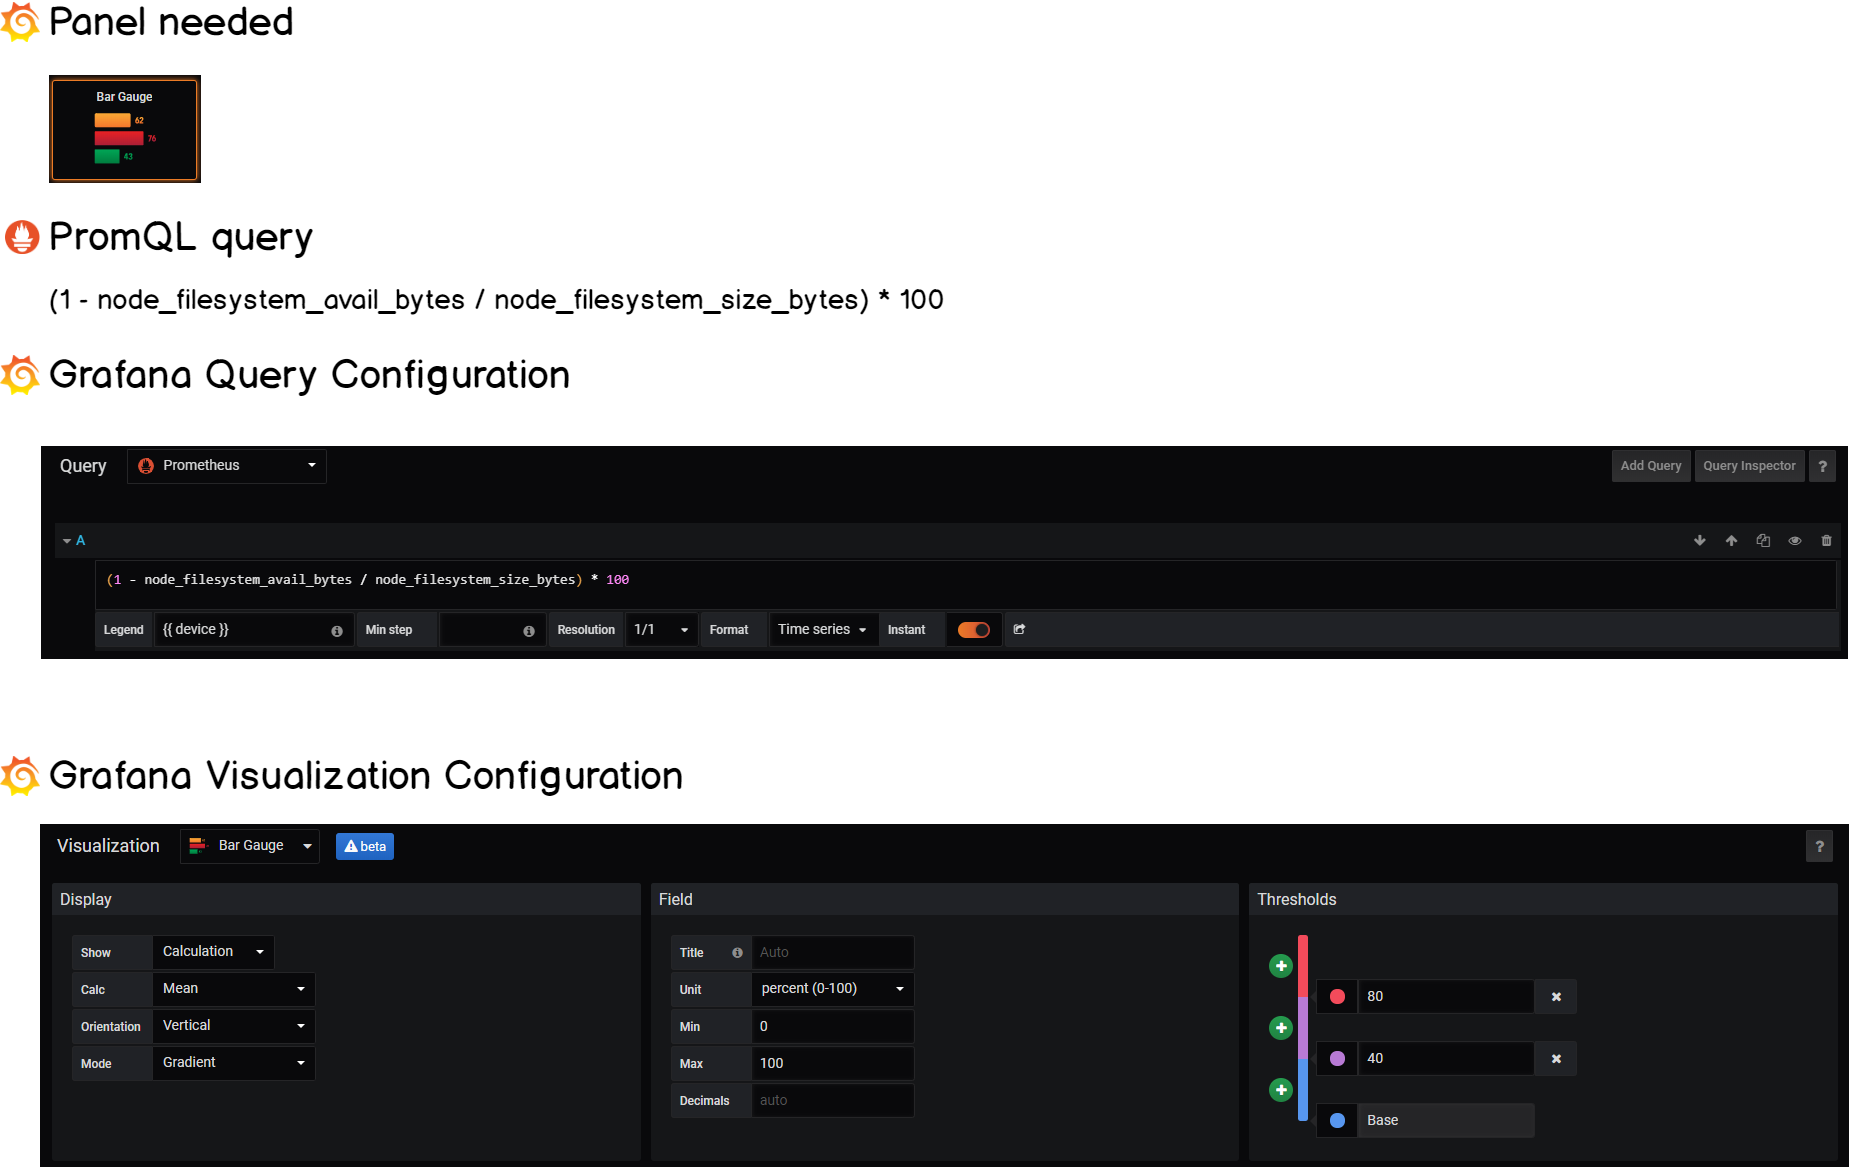
a – Filesystem tracking
Our first panel will be monitoring filesystems and more precisely the overall space remaining on various filesystems.
The node exporter exports two metrics for us to retrieve such statistics : node_filesystem_avail_bytes and node_filesystem_size_bytes.
One divided by the other will give us the overall filesystem usage by device or by mountpoint, as you prefer.
As always, here’s the cheatsheet:
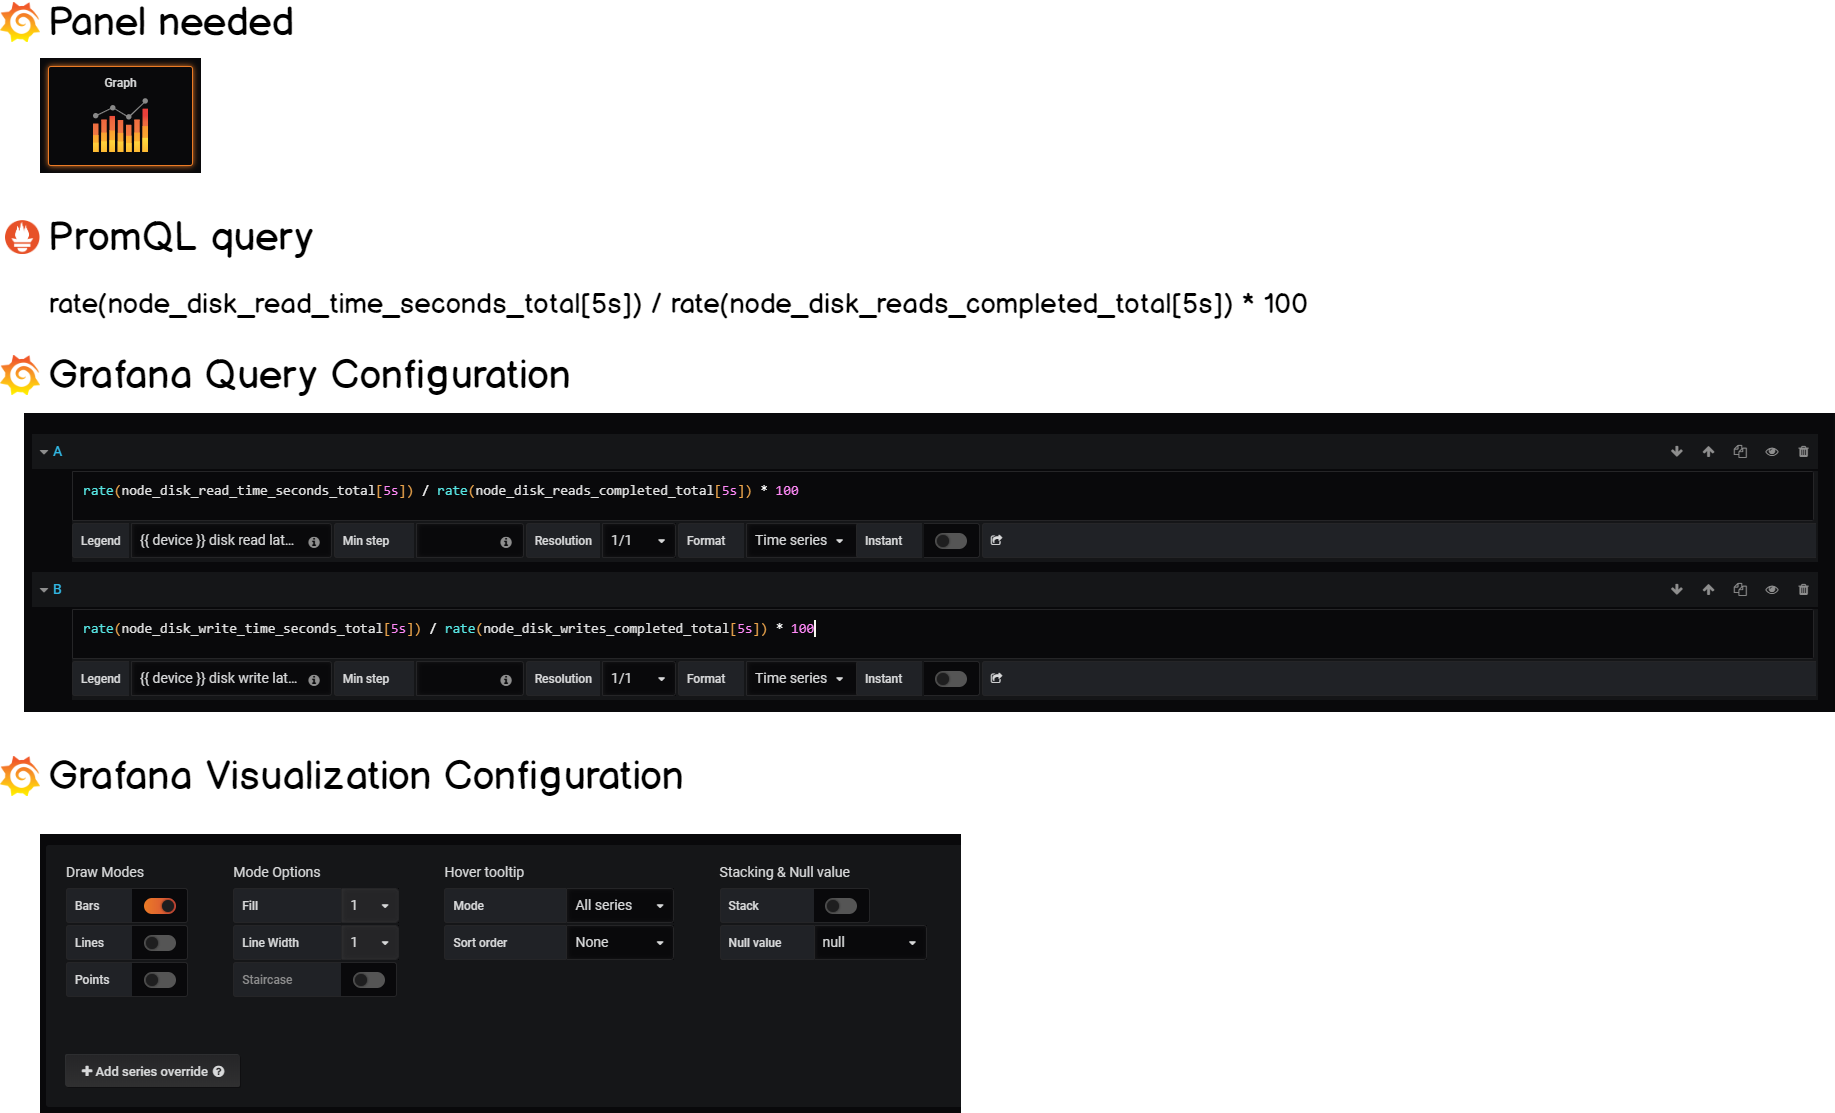
b – Read & Write Latencies
Another great metric for us to monitor is the read and write latencies on our disks.
The node exporter exports multiple metrics for us to compute it.
On the read side, we have:
node_disk_read_time_seconds_totalnode_disk_reads_completed_total
On the write side, we have:
node_disk_write_time_seconds_totalnode_disk_writes_completed_total
If we compute rates for the two metrics, and divide one by the other, we are able to compute the latency or the time that your disk takes in order to complete such operations.
Let’s see the cheatsheet.
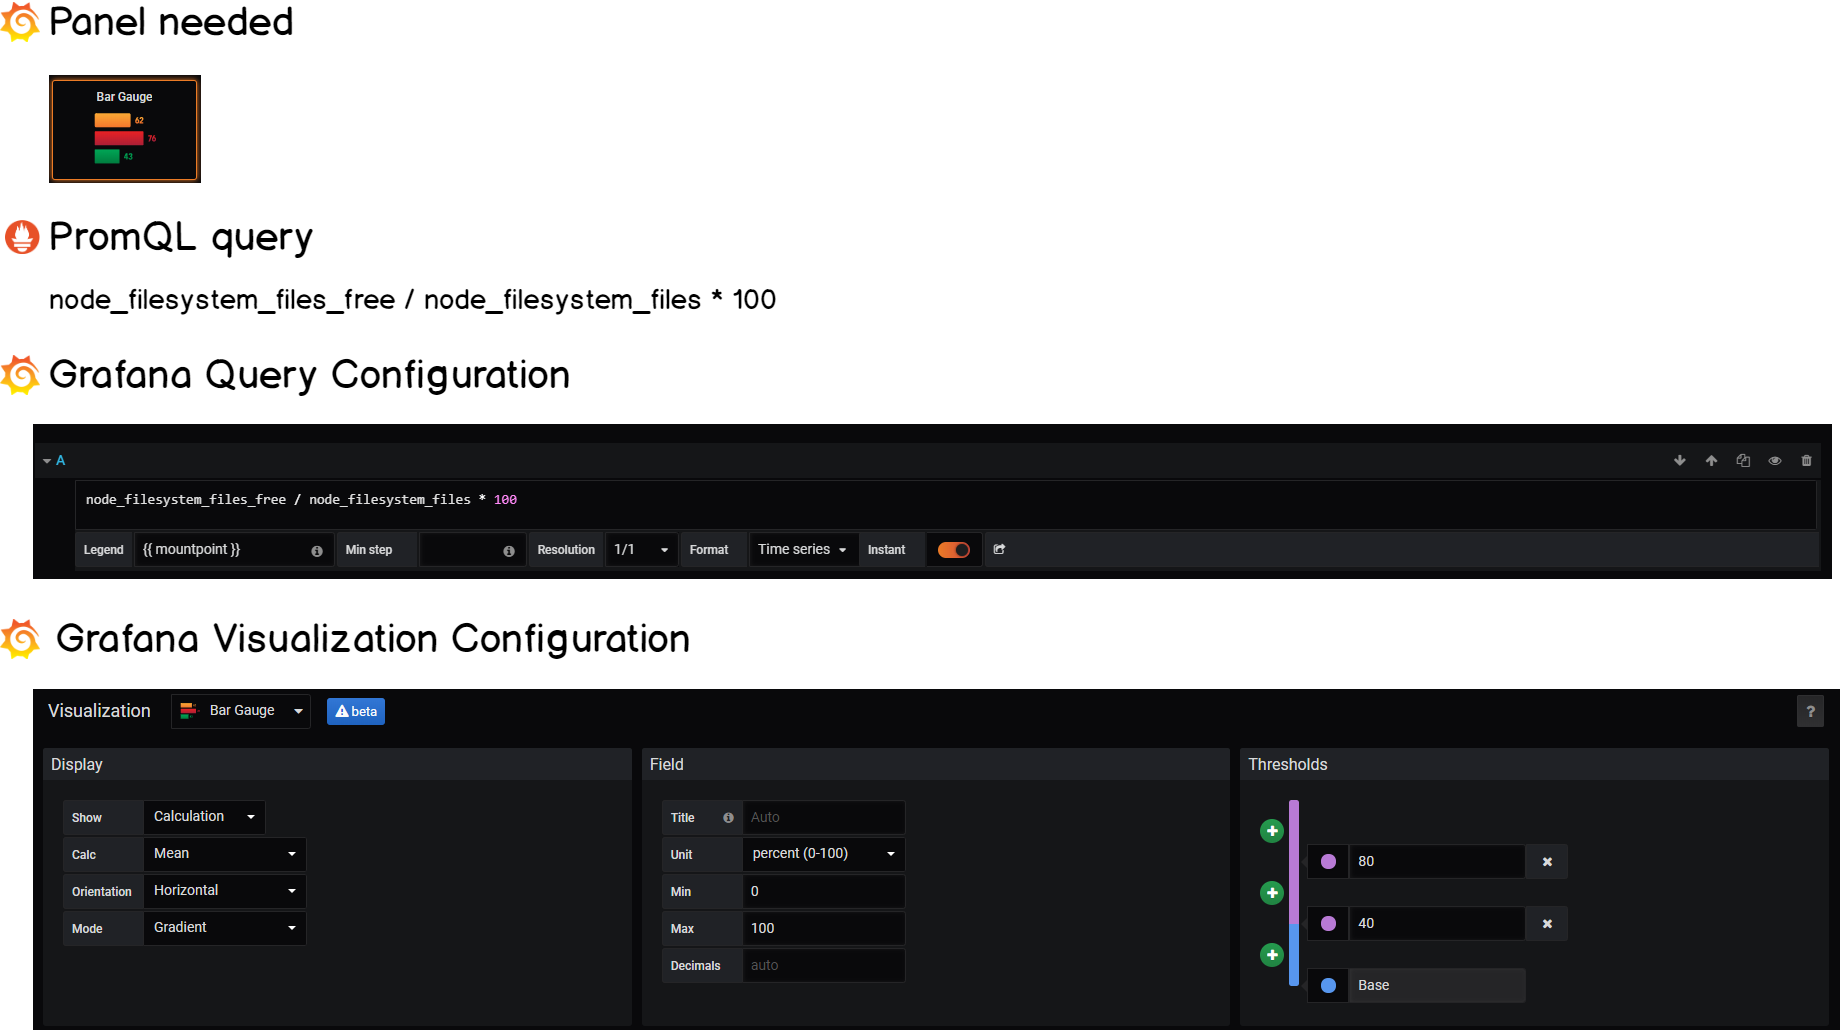
c – Number of inodes on our system
Now that we know the read and write latencies on system, you might want to know the number of inodes still available on your system.
Fortunately, this is also something exposed by the node exporter:
node_filesystem_files_freenode_filesystem_files
Following the same logic, one divided by the other gives us the number of inodes available on our instance.
Here’s the Grafana cheatsheet:
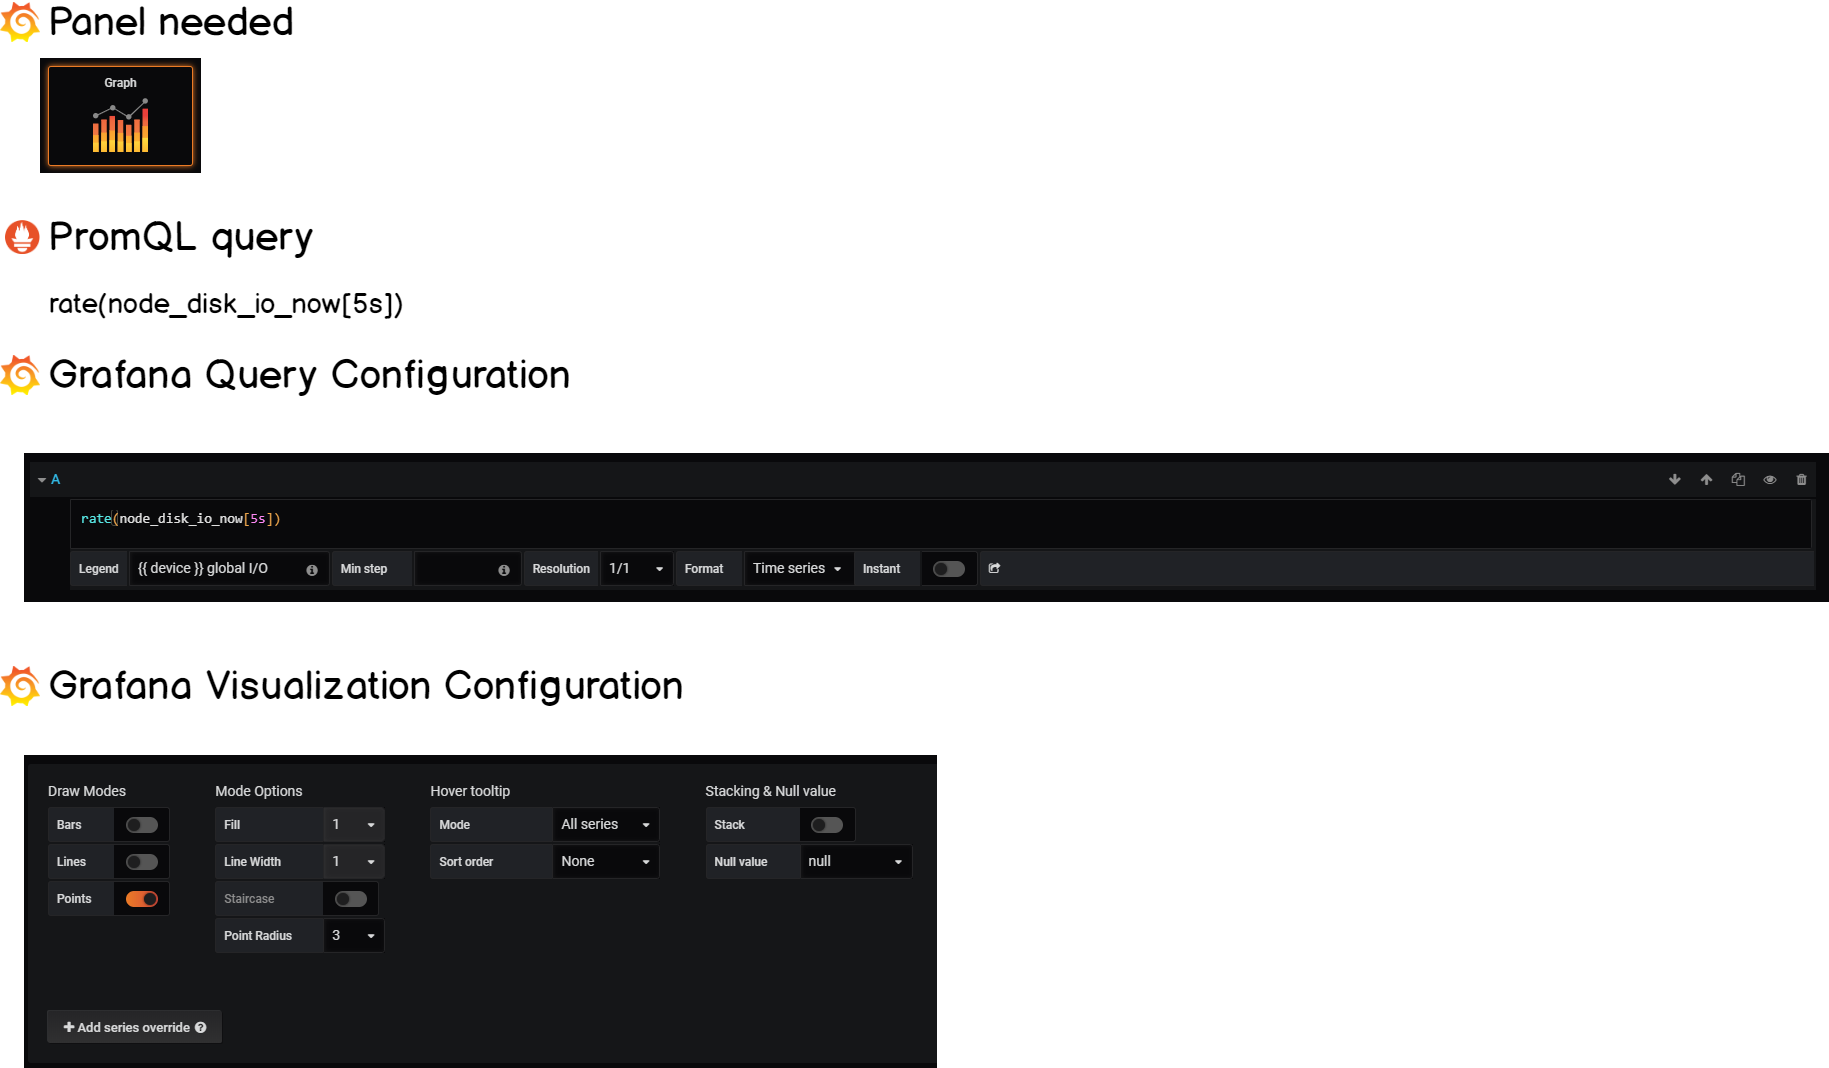
d – Overall I/O load on your instance
This is an easy one.
As a global healthcheck for our system, we want to be able to know the overall I/O load on your system. The node exporter exposes the following metric :
-
node_disk_io_now
Computing the rate for this metric will give the overall I/O load.
The final cheatsheet is as follows:

Congratulations!
You built an entire dashboard for disk I/O monitoring (with a futuristic theme!)
Bonus Lesson : custom alerts for disk I/O
Visualizations are awesome, but sometimes you want to be alerted when something happens on your disks. If you followed the definitive guide on Prometheus, you know that Prometheus works with the Alert Manager to raise custom alerts.
Samuel Berthe (@samber on Github), and creator of awesome-prometheus-alerts made a very complete list of alerts that you can implement in order to monitor your systems.
Here are the rules related to disk usage, all credits goes to @samber for those.

- alert: UnusualDiskReadRate
  expr: sum by (instance) (irate(node_disk_read_bytes_total[2m])) / 1024 / 1024 > 50
  for: 30m
  labels:
    severity: warning
  annotations:
    summary: "Unusual disk read rate (instance {{ $labels.instance }})"
    description: "Disk is probably reading too much data (> 50 MB/s)\n  VALUE = {{ $value }}\n  LABELS: {{ $labels }}"
- alert: UnusualDiskWriteRate
  expr: sum by (instance) (irate(node_disk_written_bytes_total[2m])) / 1024 / 1024 > 50
  for: 30m
  labels:
    severity: warning
  annotations:
    summary: "Unusual disk write rate (instance {{ $labels.instance }})"
    description: "Disk is probably writing too much data (> 50 MB/s)\n  VALUE = {{ $value }}\n  LABELS: {{ $labels }}"
- alert: OutOfDiskSpace
  expr: node_filesystem_free_bytes{mountpoint ="/rootfs"} / node_filesystem_size_bytes{mountpoint ="/rootfs"} * 100 < 10
  for: 30m
  labels:
    severity: warning
  annotations:
    summary: "Out of disk space (instance {{ $labels.instance }})"
    description: "Disk is almost full (< 10% left)\n  VALUE = {{ $value }}\n  LABELS: {{ $labels }}"
- alert: UnusualDiskReadLatency
  expr: rate(node_disk_read_time_seconds_total[1m]) / rate(node_disk_reads_completed_total[1m]) > 100
  for: 30m
  labels:
    severity: warning
  annotations:
    summary: "Unusual disk read latency (instance {{ $labels.instance }})"
    description: "Disk latency is growing (read operations > 100ms)\n  VALUE = {{ $value }}\n  LABELS: {{ $labels }}"
A Word To Conclude
Towards this tutorial, you learned that you can easily monitor disk I/O on your instances with Prometheus and Grafana.
Monitoring such metrics is essential for every sysadmin that wants concrete clues of server bottlenecks.
Now you are able to tell if they are coming from read latencies, write latencies or a filesystem that is running out of space.
With Disk I/O, we just scratched the surface of what the node exporter can do, there are actually many more options and you should explore them.
If you created a very cool dashboard with the tools shown above, make sure to show it to us, it is always appreciated to see how creative you can be!
I hope that you learned something new today.
Until then, have fun, as always.
Icons made by Freepik from www.flaticon.com is licensed by CC 3.0 BY
9 comments
[…] To Install InfluxDB on Windows in 2019 Complete MySQL dashboard with Grafana & Prometheus Monitoring Disk I/O on Linux with the Node… The Definitive Guide To Prometheus in 2019 4 Best Open Source Dashboard Monitoring Tools In… […]
[…] Monitoring Disk I/O on Linux with the Node Exporter […]
b – Read & Write Latencies
This is not really a percentage, is it?
I cannot see how multiplying 100 makes any sense.
Basically you divide the seconds spent waiting by number of operation in the same time to derive average time spent waiting per operation… No multiply by 100 needed or warranted.
Is there a way to create a dashboard on Grafana showing a specific filesystem’s mount status (Mounted/Unmounted)?
For the section – Read & Write Latencies, the article intends to compute the latency or the time that your disk takes in order to complete such operations. Latency is usually represented in percentile time values, which in my understanding, is well represented by the metrics which node exporter exposes already, i.e:
node_disk_read_time_seconds_total
node_disk_reads_completed_total
node_disk_write_time_seconds_total
node_disk_writes_completed_total
Could you explain why you chose to compute rates of these two metrics instead? And also, why divide each of those?
Merci
Hello,
the link to your live dashboard does not work.
Hi,
I don’t think the alert rule related to disk read latency is correct:
– alert: UnusualDiskReadLatency
expr: rate(node_disk_read_time_seconds_total[1m]) / rate(node_disk_reads_completed_total[1m]) > 100
for: 30m
To my mind, this means that if an IO takes more than 100 seconds to get done, then the alarm is triggered. Well, by that time, your server is dead. So I think either > 0.1 is correct (which means 100ms) would be the correct value.
Unrelated: I’ve discovered the site recently and it’s been extremely useful in understanding Prometheus. Thank you for that.
Thanks for making this! Could you put the PromQL queries in text so they can be copied and pasted from your article into Grafana. Secondly, you show using your VDA disk as an example in step ‘c’, could you show how one determines their disk so they can specify their own for that command.