
Whether you are a Linux system administrator or a DevOps engineer, you spend a lot of time tracking performance metrics on your servers.
You may sometimes have instances that are running very slow without having any real clues of what the issues might be.
You may have unresponsive instances that might block you from running remote commands such as top or htop on them.
You may have a simple bottleneck on your server, but you cannot identify it in a simple and quick way.
What if we had a complete dashboard that would help us tracking general performance as well as individual processes?
See it live here : http://grafana.devconnected.com/d/nZMDMoiZk/grafana-top?orgId=1&refresh=5s
The goal of this tutorial is to create a complete monitoring dashboard for Linux sysadmins.
This dashboard will showcase different panels that are entirely customizable and scalable to multiple instances for distributed architectures.
What You Will Learn
Before jumping right into this technical journey, let’s have a quick look at everything that you are going to learn by reading this article:
- Understanding current state-of-the-art ways to monitor process performance on Unix systems;
- Learn how to install the latest versions of Prometheus v2.9.2, Pushgateway v0.8.0 and Grafana v6.2;
- Build a simple bash script that exports metrics to Pushgateway;
- Build a complete Grafana dashboard including the latest panels available such as the ‘Gauge’ and the ‘Bar Gauge’;
- Bonus : implementing ad-hoc filters to track individual processes or instances.
Now that we have an overview of everything that we are going to learn, and without further due, let’s have an introduction on what’s currently existing for Unix systems.
Unix Process Monitoring Basics
When it comes to process monitoring for Unix systems, you have multiple options.
The most popular one is probably ‘top’.
Top provides a full overview of performance metrics on your system such as the current CPU usage, the current memory usage as well as metrics for individual processes.
This command is widely used among sysadmins and is probably the first command run when a performance bottleneck is detected on a system (if you can access it of course!)
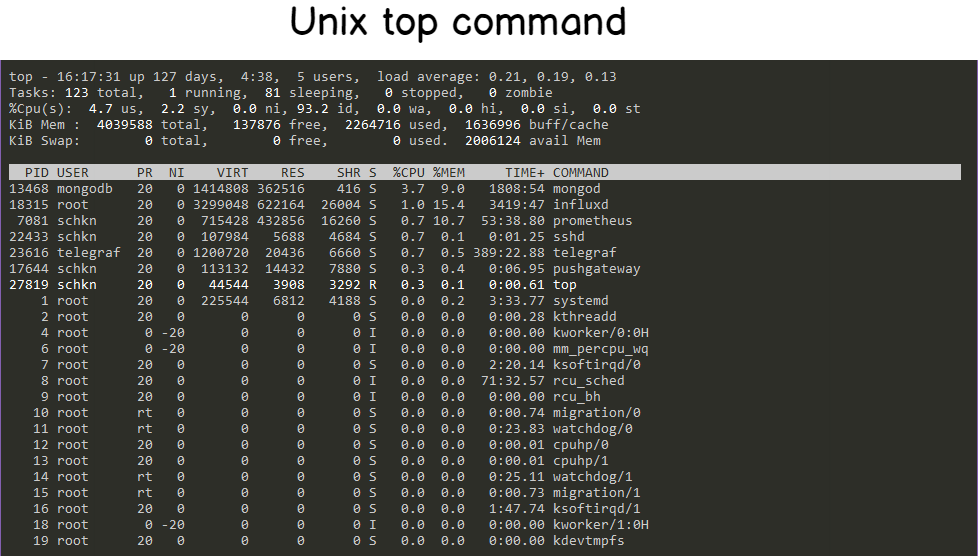
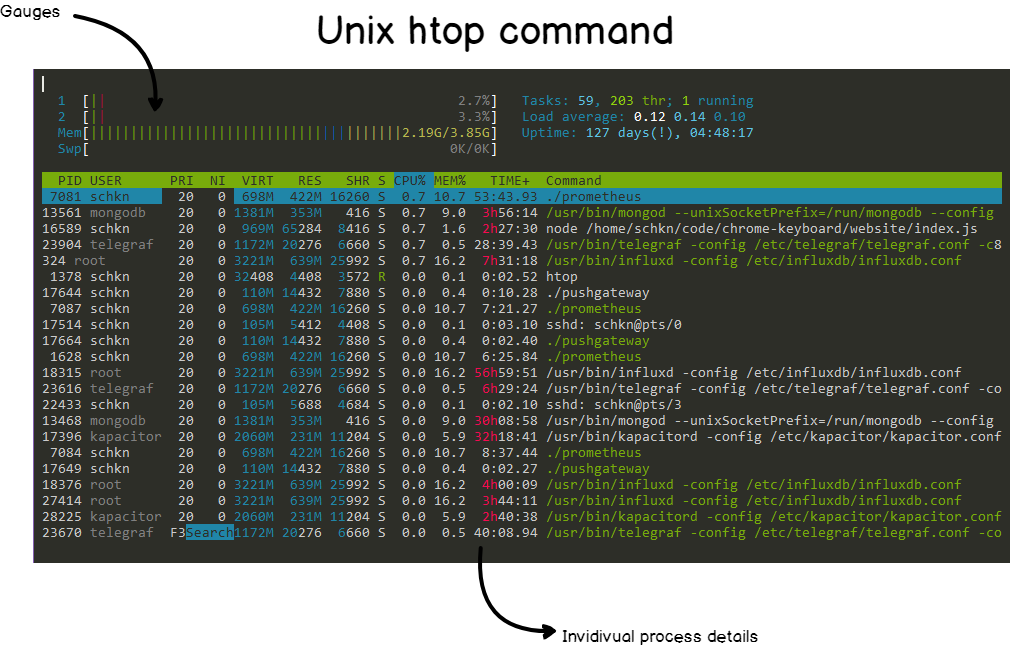
The top command is already pretty readable, but there is a command that makes everything even more readable than that: htop.
Htop provides the same set of functionalities (CPU, memory, uptime..) as top but in a colorful and pleasant way.
Htop also provides gauges that reflects current system usage.
Knowing that those two commands exist, why would we want to build yet another way to monitor processes?
The main reason would be system availability: in case of a system overload, you may have no physical or remote access to your instance.
By externalizing process monitoring, you can analyze what’s causing the outage without accessing the machine.
Another reason is that processes get created and killed all the time, often by the kernel itself.
In this case, running a top command would give you zero information as it would be too late for you to catch who’s causing performance issues on your system.
You would have to dig into kernel logs to see what has been killed.
With a monitoring dashboard, you can simply go back in time and see which process was causing the issue.
Now that you know why we want to build this dashboard, let’s have a look at the architecture put in place in order to build it.

Detailing Our Monitoring Architecture
Before having a look at the architecture that we are going to use, we want to use a solution that is:
- Resource cheap : i.e not consuming many resources on our host;
- Simple to put in place : a solution that doesn’t require a lot of time to instantiate;
- Scalable : if we were to monitor another host, we can do it quickly and efficiently.
Those are the points we will keep in mind throughout this tutorial.
The detailed architecture we are going to use today is this one:

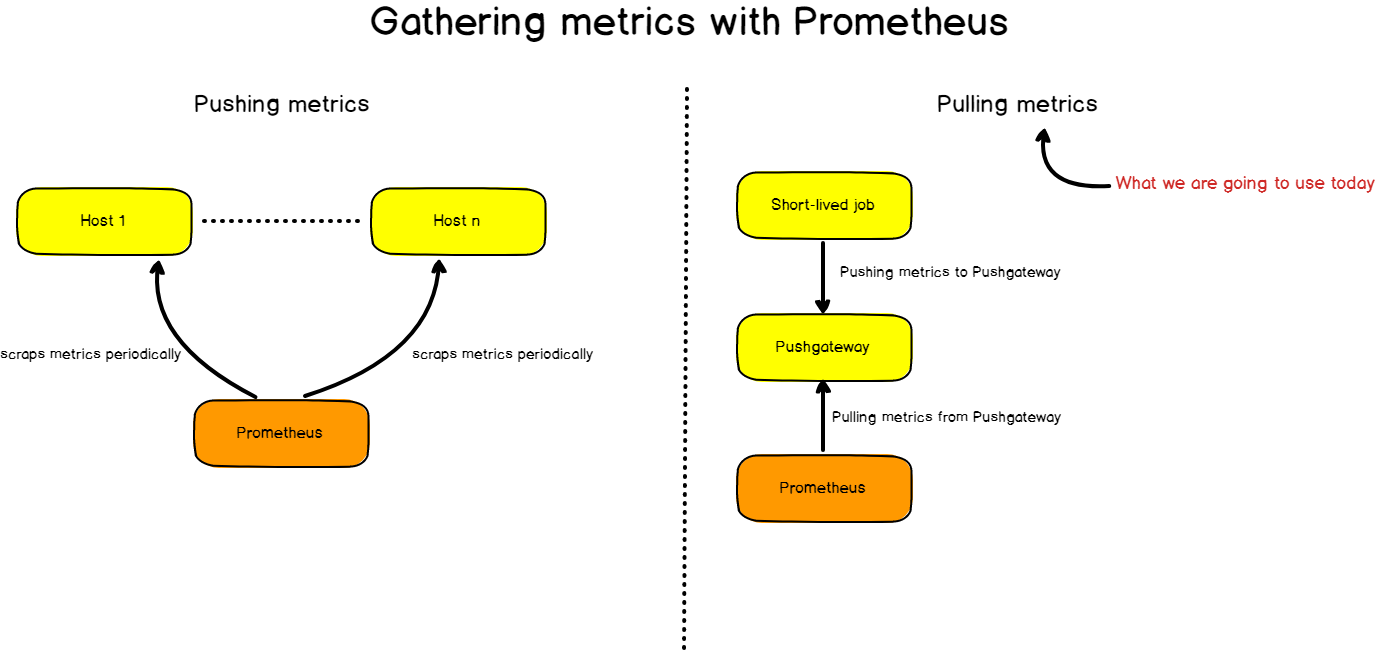
Our architecture makes use of four different components:
- A bash script used to send periodically metrics to the Pushgateway;
- Pushgateway: a metrics cache used by individual scripts as a target;
- Prometheus:, that instantiates a time series database used to store metrics. Prometheus will scrape Pushgateway as a target in order to retrieve and store metrics;
- Grafana: a dashboard monitoring tool that retrieves data from Prometheus via PromQL queries and plot them.
For those who are quite familiar with Prometheus, you already know that Prometheus scraps metrics exposed by HTTP instances and stores them.
In our case, the bash script has a very tiny lifespan and it doesn’t expose any HTTP instance for Prometheus.
This is why we have to use the Pushgateway ; designed for short-lived jobs, Pushgateway will cache metrics received from the script and expose them to Prometheus.

Installing The Different Tools
Now that you have a better idea of what’s going on in our application, let’s install the different tools needed.
a – Installing Pushgateway
In order to install Pushgateway, run a simple wget command to get the latest binaries available.
wget https://github.com/prometheus/pushgateway/releases/download/v0.8.0/pushgateway-0.8.0.linux-amd64.tar.gzNow that you have the archive, extract it, and run the executable available in the pushgateway folder.
> tar xvzf pushgateway-0.8.0.linux-amd64.tar.gz
> cd pushgateway-0.8.0.linux-amd64/
> ./pushgateway &
As a result, your Pushgateway should start as background process.
me@schkn-ubuntu:~/softs/pushgateway/pushgateway-0.8.0.linux-amd64$ ./pushgateway &

[1] 22806
me@schkn-ubuntu:~/softs/pushgateway/pushgateway-0.8.0.linux-amd64$
INFO[0000] Starting pushgateway (version=0.8.0, branch=HEAD, revision=d90bf3239c5ca08d72ccc9e2e2ff3a62b99a122e)  source="main.go:65"INFO[0000] Build context (go=go1.11.8, user=root@00855c3ed64f, date=20190413-11:29:19)  source="main.go:66"INFO[0000] Listening on :9091.                           source="main.go:108"
Nice!
From there, Pushgateway is listening to incoming metrics on port 9091.
b – Installing Prometheus
As described in the ‘Getting Started’ section of Prometheus’s website, head over to https://prometheus.io/download/ and run a simple wget command in order to get the Prometheus archive for your OS.
wget https://github.com/prometheus/prometheus/releases/download/v2.9.2/prometheus-2.9.2.linux -amd64.tar.gzNow that you have the archive, extract it, and navigate into the main folder:
> tar xvzf prometheus-2.9.2.linux-amd64.tar.gz
> cd prometheus-2.9.2.linux-amd64/
As stated before, Prometheus scraps ‘targets’ periodically to gather metrics from them. Targets (Pushgateway in our case) need to be configured via Prometheus’s configuration file.
> vi prometheus.yml In the ‘global’ section, modify the ‘scrape_interval’ property down to one second.
global:
  scrape_interval:     1s # Set the scrape interval to every 1 second.
In the ‘scrape_configs’ section, add an entry to the targets property under the static_configs section.
static_configs:
            - targets: ['localhost:9090', 'localhost:9091']
Exit vi, and finally run the prometheus executable in the folder.
Prometheus should start when launching the final prometheus command. To ensure that everything went correctly, you can head over to http://localhost:9090/graph.
If you have access to Prometheus’s web console, it means that everything went just fine.
You can also verify that Pushgateway is correctly configured as a target in ‘Status’ > ‘Targets’ in the Web UI.

c – Installing Grafana
If you are looking for a tutorial to install Grafana on Ubuntu 18.04, just follow the link!
Last not but least, we are going to install Grafana v6.2. Head over to https://grafana.com/grafana/download/beta.
As done before, run a simple wget command to get it.
> wget https://dl.grafana.com/oss/release/grafana_6.2.0-beta1_amd64.deb> sudo dpkg -i grafana_6.2.0-beta1_amd64.debNow that you have extracted the deb file, grafana should run as a service on your instance.
You can verify it by running the following command:
> sudo systemctl status grafana-server
● grafana-server.service - Grafana instance
   Loaded: loaded (/usr/lib/systemd/system/grafana-server.service; disabled; vendor preset: enabled)
   Active: active (running) since Thu 2019-05-09 10:44:49 UTC; 5 days ago
     Docs: http://docs.grafana.org
You can also check http://localhost:3000 that is the default address for Grafana Web UI.
Now that you have Grafana on your instance, we have to configure Prometheus as a datasource.
You can configure your datasource this way :
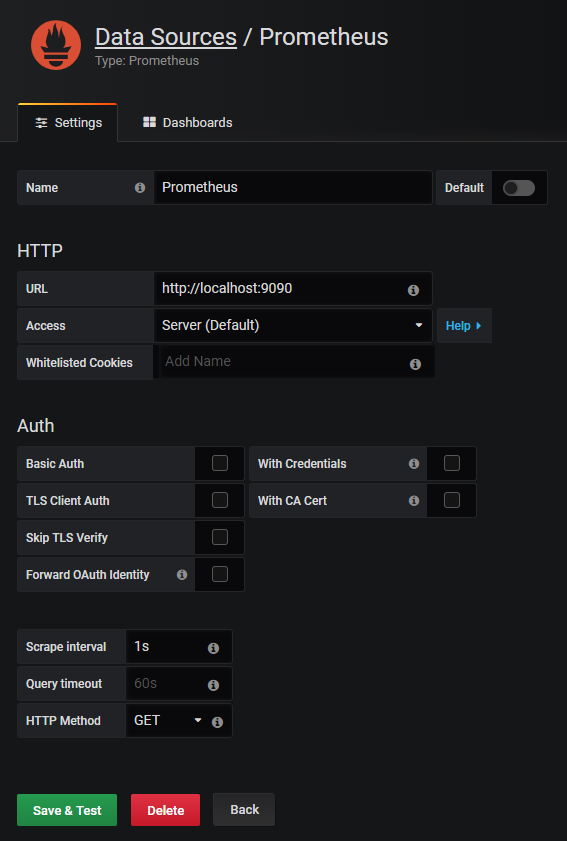
That’s it!
Click on ‘Save and Test’ and make sure that your datasource is working properly.

Building a bash script to retrieve metrics
Your next task is to build a simple bash script that retrieve metrics such as the CPU usage and the memory usage for individual processes.
Your script can be defined as a cron task that will run every second later on.
To perform this task, you have multiple candidates.
You could run top commands every second, parse it using sed and send the metrics to Pushgateway.
The hard part with top is that it runs on multiple iterations, providing a metrics average over time. This is not really what we are looking for.
Instead, we are going to use the ps command and more precisely the ps aux command.
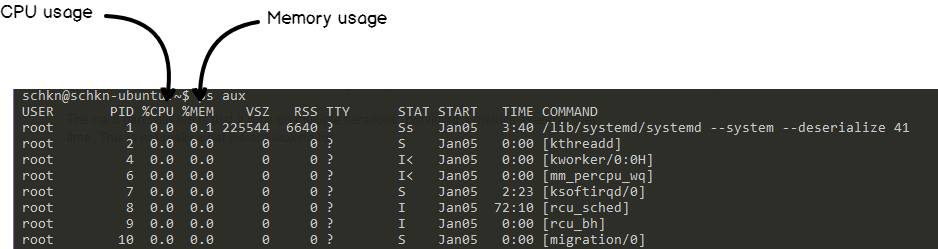
This command exposes individual CPU and memory usages as well as the exact command behind it.
This is exactly what we are looking for.
But before going any further, let’s have a look at what Pushgateway is expecting as an input.
Pushgateway, pretty much like Prometheus, works with key value pairs: the key describes the metric monitored and the value is self explanatory.
Here are some examples:

As you can tell, the first form simply describes the CPU usage, but the second one describes the CPU usage for the java process.
Adding labels is a way of specifying what your metric describes more precisely.
Now that we have this information, we can build our final script.
As a reminder, our script will perform a ps aux command, parse the result, transform it and send it to the Pushgateway via the syntax we described before.
Create a script file, give it some rights and navigate to it.
> touch better-top
> chmod u+x better-top
> vi better-top
Here’s the script:
#!/bin/bash
z=$(ps aux)
while read -r z
do
   var=$var$(awk '{print "cpu_usage{process=\""$11"\", pid=\""$2"\"}", $3z}');
done <<< "$z"
curl -X POST -H  "Content-Type: text/plain" --data "$var
" http://localhost:9091/metrics/job/top/instance/machine
If you want the same script for memory usage, simply change the ‘cpu_usage’ label to ‘memory_usage’ and the $3z to $4z
So what does this script do?
First, it performs the ps aux command we described before.
Then, it iterates on the different lines and formats it accordingly to the key-labeled value pair format we described before.
Finally, everything is concatenated and sent to the Pushgateway via a simple curl command.
Simple, isn’t it?
As you can tell, this script gathers all metrics for our processes but it only runs one iteration.
For now, we are simply going to execute it every one second using a sleep command.
Later on, you are free to create a service to execute it every second with a timer (at least with systemd).
Interested in systemd? I made a complete tutorial about monitoring them with Chronograf
> while sleep 1; do ./better-top; done;Now that our metrics are sent to the Pushgateway, let’s see if we can explore them in Prometheus Web Console.
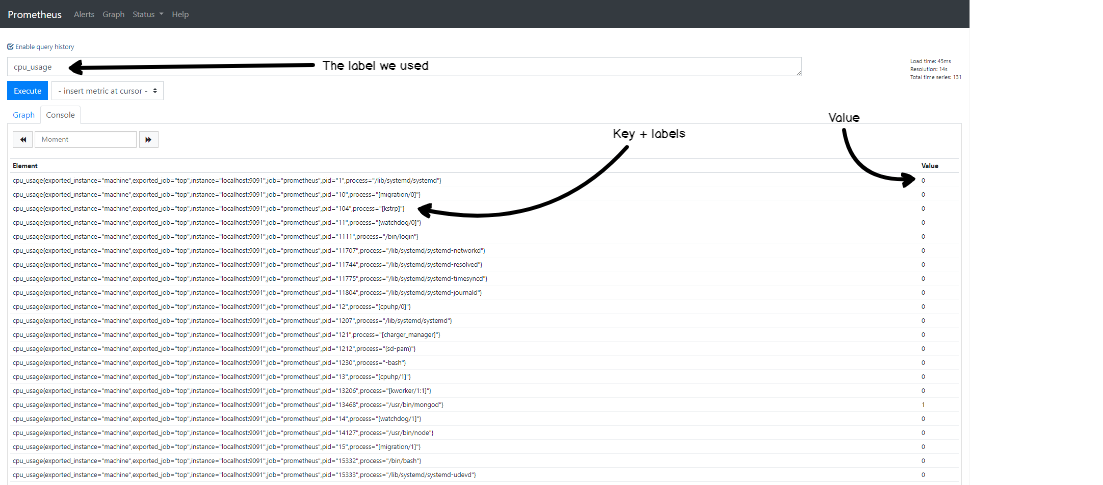
Head over to http://localhost:9090. In the ‘Expression’ field, simply type ‘cpu_usage’. You should now see all metrics in your browser.
Congratulations! Your CPU metrics are now stored in Prometheus TSDB.
.

Building An Awesome Dashboard With Grafana
Now that our metrics are stored in Prometheus, we simply have to build a Grafana dashboard in order to visualize them.
We will use the latest panels available in Grafana v6.2 : the vertical and horizontal bar gauges, the rounded gauges and the classic line charts.
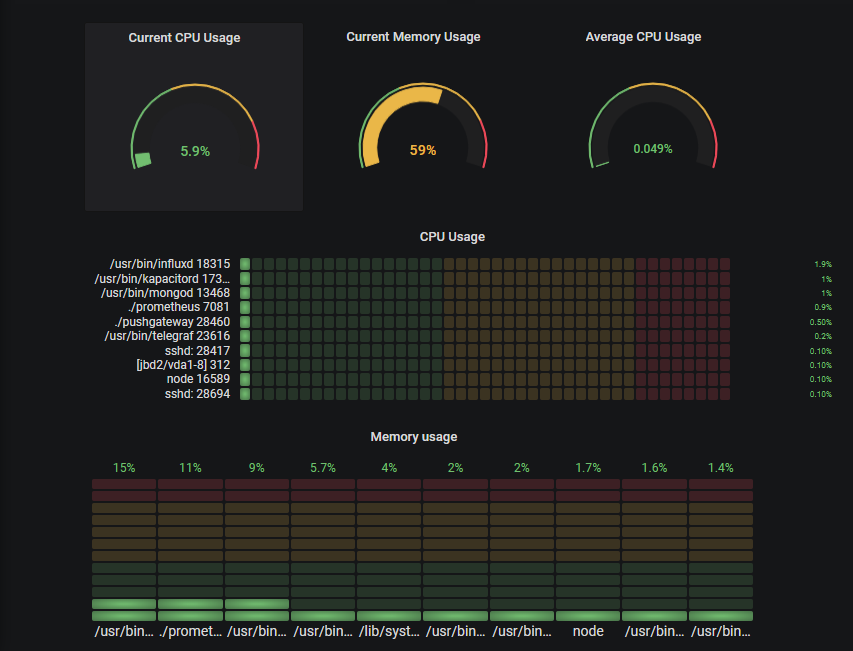
For your comfort, I have annotated the final dashboard with numbers from 1 to 4.
They will match the different subsections of this chapter. If you’re only interested in a certain panel, head over directly to the corresponding subsection.

1 – Building Rounded Gauges
Here’s a closer view of what rounded gauges in our panel.
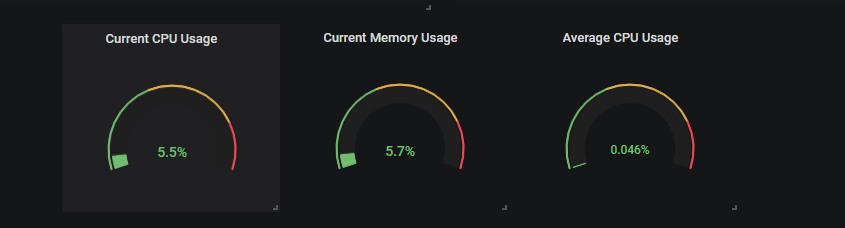
For now, we are going to focus on the CPU usage of our processes as it can be easily mirrored for memory usage.
With those panels, we are going to track two metrics : the current CPU usage of all our processes and the average CPU usage.
In order to retrieve those metrics, we are going to perform PromQL queries on our Prometheus instance?
So.. what’s PromQL?
PromQL is the query language designed for Prometheus.
Similarly what you found find on InfluxDB instances with InfluxQL (or IFQL), PromQL queries can aggregate data using functions such as the sum, the average and the standard deviation.
The syntax is very easy to use as we are going to demonstrate it with our panels.
a – Retrieving the current overall CPU usage
In order to retrieve the current overall CPU usage, we are going to use PromQL sum function.
At a given moment in time, our overall CPU usage is simply the sum of individual usages.
Here’s the cheat sheet:

b – Retrieving the average CPU usage
Not much work to do for average CPU usage, you are simply going to use the avg function of PromQL. You can find the cheat sheet below.

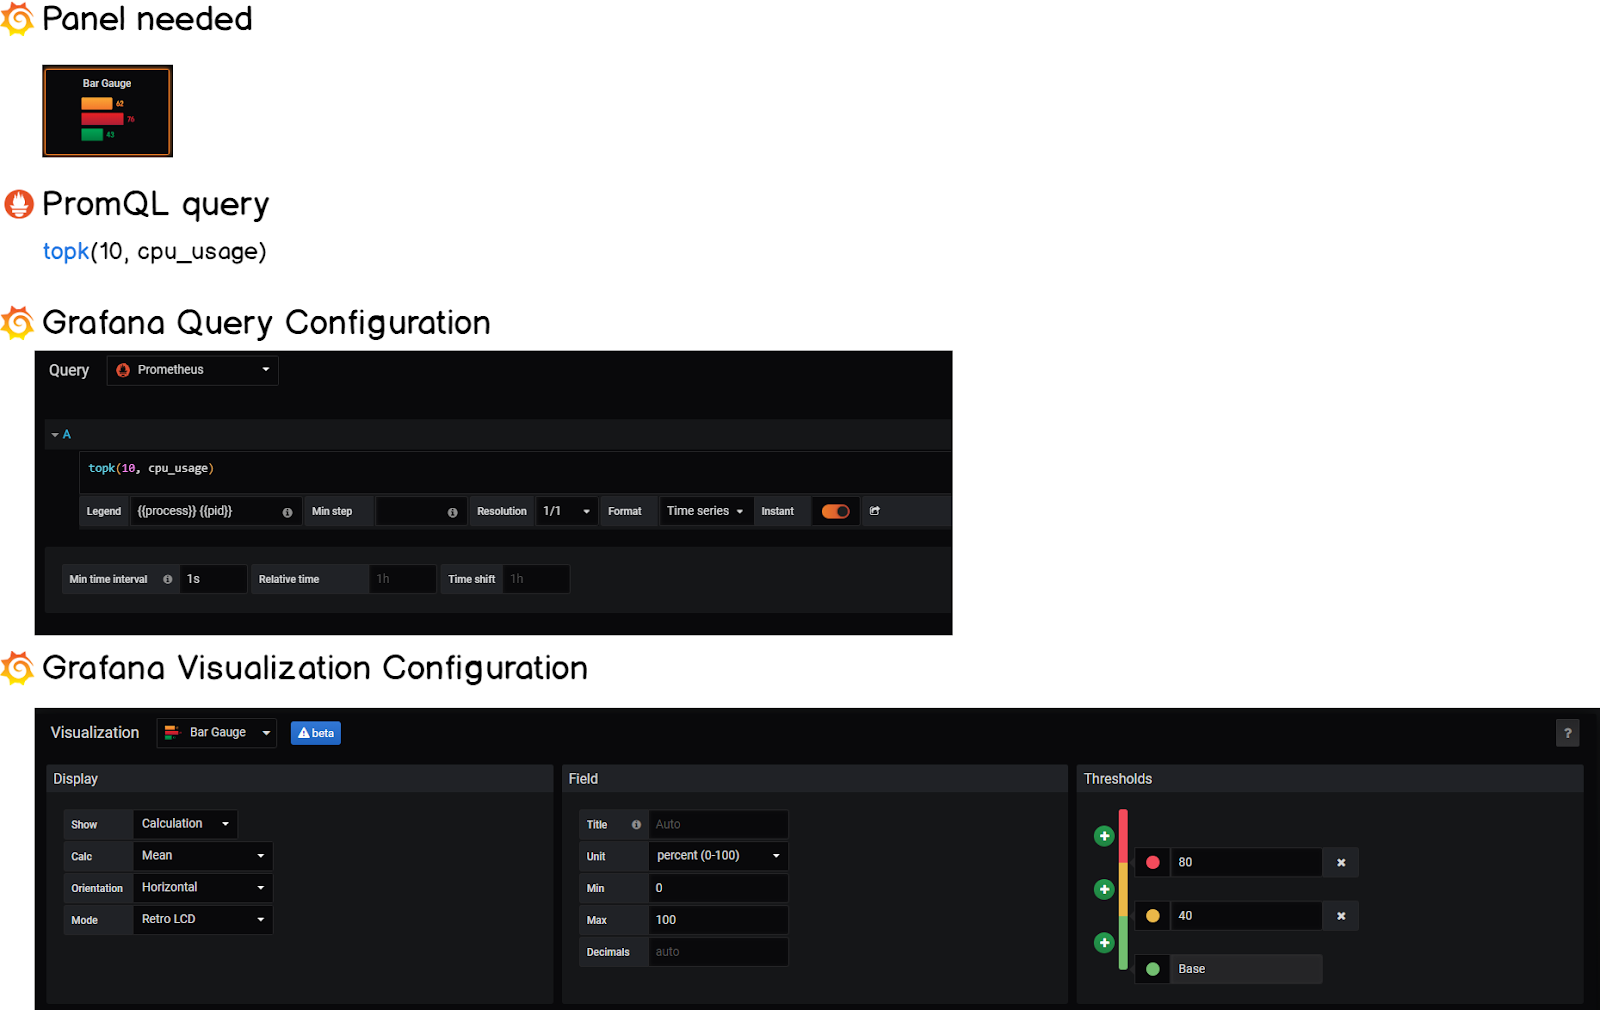
2 – Building Horizontal Gauges
Horizontal gauges are one of the latest additions of Grafana v6.2.
Our goal with this panel is to expose the top 10 most consuming processes of our system.
To do so, we are going to use the topk function that retrieves the top k elements for a metric.
Similarly to what we did before, we are going to define thresholds in order to be informed when a process is consuming too many resources.
3 – Building Vertical Gauges
Vertical gauges are very similar to horizontal gauges, we only need to tweak the orientation parameter in the visualization panel of Grafana.
Also, we are going to monitor our memory usage with this panel so the query is slightly different.
Here’s the cheat sheet:

Awesome! We made great progress so far, one panel to go.
4 – Building Line Graphs
Line graphs have been in Grafana for a long time and this is the panel that we are going to use to have an historical view of how our processes have evolved over time.
This graph can be particularly handy when :
- You had some outage in the past and would like to investigate which processes were active at the time.
- A certain process died but you want to have a view of its behaviour right before it happened
When it comes to troubleshooting exploration, it would honestly need a whole article (especially with the recent Grafana Loki addition).
Okay, here’s the final cheat sheet!

From there, we have all the panels that we need for our final dashboard.
You can arrange them the way you want or simply take some inspiration from the one we built.

Bonus : explore data using ad hoc filters
Real time data is interesting to see – but the real value comes when you are able to explore your data.
In this bonus section, we are not going to use the ‘Explore’ function (maybe in another article?), we are going to use ad hoc filters.
With Grafana, you can define variables associated to a graph. You have many different options for variables : you can for example define a variable for your data source that would allow to dynamically switch the datasource in a query.
In our case, we are going to use simple ad hoc filters to explore our data.

From there, simply click on ‘Variables’ in the left menu, then click on ‘New’.

As stated, ad hoc filters are automatically applied to dashboards that target the Prometheus datasource. Back to our dashboard.
Take a look at the top left corner of the dashboard.

Filters!
Now let’s say that you want the performance of a certain process in your system : let’s take Prometheus itself for example.
Simply navigate into the filters and see the dashboard updating accordingly.

Now you have a direct look at how Prometheus is behaving on your instance.
You could even go back in time and see how the process behaved, independently from its pid!

A quick word to conclude
From this tutorial, you now have a better understanding of what Prometheus and Grafana have to offer.
You know have a complete monitoring dashboard for one instance, but there is really a small step to make it scale and monitor an entire cluster of Unix instances.
DevOps monitoring is definitely an interesting subject – but it can turn into a nightmare if you do it wrong.
This is exactly why we write those articles and build those dashboards : to help you reach the maximum efficiency of what those tools have to offer.
We believe that great tech can be enhanced with useful showcases.
Do you?
If you agree, join the growing list of DevOps who chose this path.
It is as simple as subscribing to our newsletter : get those tutorials right into your mailbox!
I made similar articles, so if you enjoyed this one, make sure to read the others :
- Monitoring Windows services using Grafana, Telegraf and InfluxDB.
- The Definitive Guide To InfluxDB in 2019
Until then, have fun, as always.
51 comments
What about security? Can I set a passwords so no random people can access my dashboards?
Security has two aspects in Grafana.
You can either configure the security for internal users of your Grafana, i.e logged users, and the documentation is available here : https://grafana.com/docs/permissions/dashboard_folder_permissions/
For ‘anonymous users’, you can set some parameters in Grafana’s configuration : https://grafana.com/docs/auth/overview/ (see anonymous section).
You can set default users to a certain group, which would have no access to dashboards for example.
Why aren’t you just using node_exporter? Much more comprehensive and simpler.
Why aren’t you just using node_exporter? It would seem to be a much better choice then a Bash script.
node exporter doesn’t provide per process metrics
I would say your image called Gathering Metrics with Prometheus is the wrong way around?
Surely here you’re using push as opposed to a normal Prometheus setup where Prometheus will pull from services exposing metrics via HTTP.
Great tutorial! This is showing how we seeing the metrics of a single instance. How would you implement this for auto scaling environments e.g. AWS Elastic Beanstalk, AWS Elastic Load Balancer?
Thanks for sharing, always nice to see options around although, I think there definitely needs to be some limitations when using the two together.
I think i Just broke your server by accident when changing the timescale to 90 days. I tried it in a couple of tabs to check and second one just stalled from start
[…] Monitoring Linux Processes using Prometheus and Grafana […]
Thank you very much for this awesome tutorial! I used the bash script and had no problems getting data to log. However I’m having issues doing the same thing with PHP. I’ve been tearing my hair out trying to figure out why it won’t work. Not sure if there’s anyone here with PHP experience? I’m trying to POST the data to Pushgateway. I’ve tried using PHP’s curl_exec and can’t get that to work. I’m trying the following file_get_contents simple process and can’t get this to work either. Anyone have ideas?
$url = ‘http://mymachine.mydomain.local:9091/metrics/job/top/instance/machine’;
$postdata = http_build_query(
array(
‘cpu_usage’ => ‘1’,
‘cpu_usage’ => ‘2’
)
);
$context_options = array (
‘http’ => array (
‘method’ => ‘POST’,
‘header’=> “Content-Type: application/x-www-form-urlencoded\r\n”
. “Content-Length: ” . strlen($postdata) . “\r\n”,
‘content’ => $postdata
)
);
$context = stream_context_create($context_options);
$result = file_get_contents($url, false, $context);
Returns “failed to open stream: HTTP request failed! HTTP/1.0 400 Bad Request”
Have you tried using Postman to perform the request? Sometimes it can resolve many trivial issues with sending data to the Pushgateway.
[…] Monitoring Linux Processes using Prometheus and Grafana […]
First of all, thanks for this tutorial. IT was very clear and helpfull.
I’m blocked on the step of the script for metrics retrieval sent. I’m getting the error:
“text format parsing error in line 203: unexpected end of input stream”
I also tried to send only one line but same error:
“text format parsing error in line 1: unexpected end of input stream”
Have you got any idea of where’s my error?
BTW I copied exactly your script with cpu_usage.
[…] Monitoring Linux Processes using Prometheus and Grafana […]
I have a problem. I want to monitor disk svctm, since there isn’t any solution that give me that. I’m following your tutorial, and memory and cpu is working like a charm, but svctm doesn’t. My svctm script is like this:
#!/bin/bash
z=$(sar -dp | grep -v Average | grep -vi tps | grep -v Linux | grep -v AIX | grep -v configuration)
# sar -dp | grep -v Average | grep -vi tps | grep -v Linux | grep -v AIX | grep -v configuration | awk ‘{print $3,$10}’
while read -r z
do
var=$var$(awk ‘{print “svctm{disk=\””$3″\”}”, $10z}’);
done <<< "$z"
curl -X POST -H "Content-Type: text/plain" –data "$var
" http://localhost:9091/metrics/job/top/instance/machine
And I can see the data in pushgateway, but it isn't passing any data to prometheus. I'm still trying to debug the problem, but if you have any clue, it would be awesome.
Hi Schkn,
Great tutorial, can we do the same thing using influxdb & telegrafa on for windows system?
[…] Monitoring Linux Processes using Prometheus and Grafana […]
[…] Monitoring Linux Processes using Prometheus and Grafana […]
[…] & Prometheus Complete Node Exporter Mastery with Prometheus InfluxDays London 2019 Recap Monitoring Linux Processes using Prometheus and Grafana The Definitive Guide To InfluxDB In 2019 4 Best Time Series Databases To Watch in… How To […]
Hi,
I also got the error: “text format parsing error in line 1: unexpected end of input stream”
The problem may occur in formatting the script after copying because the “new line” is invisible.
I made a small change to the script, which makes it more visible. I hope it is helpful. And thank you so much for the excellent tutorial.
#!/bin/bash
z=$(ps aux)
while read -r z
do
var=$var$(awk ‘{print “cpu_usage{process=\””$11″\”, pid=\””$2″\”}”, $3z}’);
done <<< "$z"
newline=$'\n'
curl -X POST -H "Content-Type: text/plain" –data "$var$newline" http://localhost:9091/metrics/job/top/instance/machine
Thank you very much for this guide.
Is it possible to achieve this for following scenario-
At the top of Dashboard have a drop down to select which host to monitor and then I see the graphs only for that specific host?
Thanks in advance.
Of course! You can define adhoc filters in Grafana and have a variable targeting the hostname you are trying to monitor.
(The last chapter actually explains adhoc filters)
i dont see a cpu_usage metrics available in prometheus….its strange why others have not raised this issue.
Hi Schkn,
Great tutorial, just what I needed. But, I’m finding difficulties seeing cpu_usage metrics on Prometheus, I followed every step above and unfortunately can’t see the metrics.
Also, when I type curl localhost:9091/metrics – don’t see ‘cpu_usage’ there either. The bash script is the same as you have posted above. I’m trying to resolve this problem, but if you could guide me somehow or maybe I’m missing something, I would be appreciate it a lot.
Thank you in advance.
Very interesting! Is it possible to monitor the top 5 processes in a similar way using collectd and graphite instead of prometheus?
Very interesting! Is it possible to monitor the top 10 processes in a similar way ?
great tutorial, is saved my day yesterday.
But today I realized the the script sending the cpu usage with “ps aux”. “ps” is showing an average of the cpu usage of the process but not the current usage. I crated a similar script which is using “top” and therefore shows the current usage of cpu and memory.
#!/bin/bash
# script to collect the cpu and memory usage of the given tool
#
# execute it as a cronjob or in a endless loop:
# while sleep 10; do ./push-top.sh [application-name] ; done;
TOOL=`whoami`
if [ ! -z “$1″ ]
then
TOOL=$1
fi
# add load average
var=`cat /proc/loadavg | cut -d’ ‘ -f1 | xargs echo $TOOL”_load_average”`
var=”$var
”
# collect cpu usage
# top displays wrong results on the first iteration – run it twice an grep away the firt output
LINES=`top -bcn2 | awk ‘/^top -/ { p=!p } { if (!p) print }’ | tail -n +8`
while read -r LINE
do
IN=`echo “$LINE” | tr -s ‘ ‘`
PID=`echo $IN | cut -d ‘ ‘ -f1 `
CMD=`echo $IN | cut -d ‘ ‘ -f12 `
CPU=`echo $IN | cut -d ‘ ‘ -f9 `
MEM=`echo $IN | cut -d ‘ ‘ -f10 `
var=$var$(printf “${TOOL}_cpu_usage{process=\”$CMD\”, pid=\”$PID\”} $CPU\n”)
var=”$var
”
var=$var$(printf “${TOOL}_memory_usage{process=\”$CMD\”, pid=\”$PID\”} $MEM\n”)
var=”$var
”
done <<< "$LINES"
# push to the prometheus pushgateway
curl –noproxy "*" -X POST -H "Content-Type: text/plain" –data "$var" http://pushgateway:9091/metrics/job/top/instance/machine
hi schkn,
great tutorial, buat need asking when i have more than 1 server, example server A and B , the data statistic in grafana will not update only update to server A, how to define between server A or B in push gateway?
Hello,
You will have to use a different label for a different server.
For example, in PromQL it would give :
cpu_usage{server=”server1″, location=”US”} 38.8
cpu_usage{server=”server2″, location=”IN”} 54.5
This way, you are able to differentiate between the two servers.
Also, you may want to use the Node Exporter if you are looking for a robust way to monitor your servers.
Hi schkn,
one more for current cpu usage and memory usage condition not current cpu usage , did you know how to query current cpu usage about your tutorial above ?
hi schkn
nice tutorial, may i know when i tried 2 host server ( ex. server A and B ) and filter to grafana , the data only appear from server A, from other server not appear, how to define multiple server on push gateway ? and can filter on grafana .
and one more for current cpu usage query sum(cpu_usage) it mean not existing usage cpu usage, how to query real about status cpu usage? thanks
[…] © 2019 Antoine Solnichkin for devconnected. All rights reserved Trending Monitoring Linux Processes using Prometheus and Grafana How To Set Upstream Branch on Git How To Mount and Unmount Drives on Linux How To Setup SSH […]
Hi Schkn,
Nice tutorial, thanks for sharing. have you monitored redis cluster with authentication with prometheus.
Thanks
Hello,
I haven’t monitored Redis but you can use a Redis plugin and implement the architecture built in this article in the same way.
https://github.com/oliver006/redis_exporter
Best of luck
How to permanently run push gateway service and other scripts?
Hello,
You can set up the pushgateway as a systemd service.
You can also set up systemd timers in order to periodically run scripts. Alternatively, you can have a look at cron jobs.
Thanks, these are some really great articles you have here. I have been wanting to setup grafana for quite some time now. This was a perfect Introduction.
You’re welcome!
http://grafana.devconnected.com/d/nZMDMoiZk/grafana-top?orgId=1&refresh=5s
url cannot be opened,Can you provide Dashboards to download, thank you
Can Dashboard provide download address, thank you.
how to monitor tcp and udp all port with service name and show in grafana like port no and tcp udp with service name
Rene is right, I just checked the ps man page and it says for %CPU, it takes the total cpu occupation, divided by how long the process has been running. So you will not detect fluctuations easily. I adapted their top script to read this: https://gist.github.com/kvz/ade13d8502798199fb9da844763b9832 (gist so i can update mistakes and highlighting is preserved)
This is beautiful. Thank you. I changed the ps options in better-top from ps aux to ps auxc to shorten the process name.
I am having so much fun with this. Thank you. I am going to try to add per-process disk statistics with:
pidstat -dU 5 1 | grep Average | awk ‘{print “process_disk_read{process=\””$8″\”, pid=\””$3″\”}”, $4z}’
pidstat -dU 5 1 | grep Average | awk ‘{print “process_disk_write{process=\””$8″\”, pid=\””$3″\”}”, $5z}’
Glad you like it 🙂
Love what you have built for process monitoring Exactly what I was looking for.I am might implement a golang package to deploy it as an exporter rather than just a bash script.
Does this support for UP-UX server?
This is a Great Tutorial
Documentation is indeed great am just reading this Articles today
Am I only one who completed dropped the below line
Later on, you are free to create a service to execute it every second with a timer (at least with systemd).
> while sleep 1; do ./better-top; done;
Can you add literal steps for the same as well for me like nob?