
This post focuses on installing the latest version of Grafana v6.x on a Ubuntu 18.04 machine.
Grafana is by far one of the most popular open source dashboard monitoring tools of 2019.
Used by SpaceX, Bloomberg and Booking.com, Grafana is definitely a must-have for engineers wanting a robust and scalable dashboard monitoring solution.
It can be used to monitor a wide variety of different datasources : SQL databases (MySQL or PostgreSQL), NoSQL databases and time series databases (such as InfluxDB or TimescaleDB)
If you are reading this tutorial, it is probably because you decided to bring Grafana into your infrastructure and start building awesome dashboards.
As a consequence, here are all the steps to install Grafana on Ubuntu 18.04:
Looking to install Grafana on CentOS/RHEL, we have tutorials for other distributions.
1. Update and install the newest packages available.
Note : you need administrator rights to perform this command.
$ sudo apt-get update
$ sudo apt-get upgrade
$ sudo reboot
The reboot option is optional but you may be asked by your system to do to to apply some of the changes.
2. Add the gpg key to install signed packages.
Note : you also need administrative rights in order to perform this action.
$ sudo wget -q -O - https://packages.grafana.com/gpg.key | apt-key add -Make sure that your GPG key was correctly added to your key repository.
$ sudo apt-key list
pub   rsa2048 2017-01-24 [SC]
      4E40 DDF6 D76E 284A 4A67  80E4 8C8C 34C5 2409 8CB6
uid           [unknown] Grafana <[email protected]>
sub   rsa2048 2017-01-24 [E]
Do you have the same output?
You can grep the output if your list is too long.
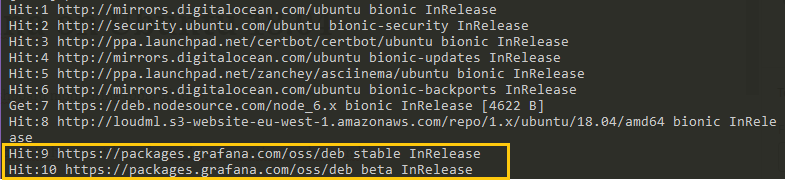
3. Update your repositories and install Grafana
Now that you are linked to Grafana repositories, you can easily install it, given the fact that your repos are updated.
$ sudo apt-get update
$ sudo apt-get install grafana
4. Inspect your grafana-service systemd service.
If you are using systemd, Grafana created a grafana-server service for you.
To ensure it, run the following command:
$ sudo ls /usr/lib/systemd/system/grafana-server.service

$ cat /usr/lib/systemd/system/grafana-server.service
[Unit]
Description=Grafana instance
Documentation=http://docs.grafana.org
Wants=network-online.target
After=network-online.target
After=postgresql.service mariadb.service mysql.service

[Service]
EnvironmentFile=/etc/default/grafana-server
User=grafana
Group=grafana
Type=simple
Restart=on-failure
WorkingDirectory=/usr/share/grafana
RuntimeDirectory=grafana
RuntimeDirectoryMode=0750
ExecStart=/usr/sbin/grafana-server                                                  \
                            --config=${CONF_FILE}                                   \
                            --pidfile=${PID_FILE_DIR}/grafana-server.pid            \
                            --packaging=deb                                         \
                            cfg:default.paths.logs=${LOG_DIR}                       \
                            cfg:default.paths.data=${DATA_DIR}                      \
                            cfg:default.paths.plugins=${PLUGINS_DIR}                \
                            cfg:default.paths.provisioning=${PROVISIONING_CFG_DIR}


LimitNOFILE=10000
TimeoutStopSec=20
UMask=0027
[Install]
WantedBy=multi-user.target
This file is quite important because it gives you much more information about your Grafana instance.
As you can see from this file :
- The Grafana server binary is located at /usr/sbin/grafana-server.
- The file that defines all the environment variables is located at /etc/default/grafana-server
- The configuration file is given via the CONF_FILE environment variable.
- The PID of the file is also determined by the PID_FILE_DIR environment variable.
- Logging, data, plugins and provisioning paths are given by environment variables.
Here’s the content of the environment variable file.
GRAFANA_USER=grafana

GRAFANA_GROUP=grafana

GRAFANA_HOME=/usr/share/grafana

LOG_DIR=/var/log/grafana

DATA_DIR=/var/lib/grafana

MAX_OPEN_FILES=10000

CONF_DIR=/etc/grafana

CONF_FILE=/etc/grafana/grafana.ini

RESTART_ON_UPGRADE=true

PLUGINS_DIR=/var/lib/grafana/plugins

PROVISIONING_CFG_DIR=/etc/grafana/provisioning

# Only used on systemd systems
PID_FILE_DIR=/var/run/grafana
5. Start your grafana-server service
Now that all your variables are declared, and that you configured your paths relatively to the way you organize data on your instance, you can launch your service.
$ sudo systemctl start grafana-server
$ sudo systemctl status grafana-server
● grafana-server.service - Grafana instance
   Loaded: loaded (/usr/lib/systemd/system/grafana-server.service; disabled; vendor preset: enab
   Active: active (running) since Sat 2019-06-08 16:01:56 UTC; 3 weeks 0 days ago
     Docs: http://docs.grafana.org
 Main PID: 642 (grafana-server)
    Tasks: 15 (limit: 4704)
   CGroup: /system.slice/grafana-server.service
           └─642 /usr/sbin/grafana-server --config=/etc/grafana/grafana.ini
Is your service set as ‘Active‘?
Great! Everything is working properly.
6. Launch Grafana v6 Web UI
Now that everything is configured properly, you should be able to access the Grafana v6 Web UI.
Open a web browser, and navigate to http://localhost:3000.
As a reminder, here are all the defaults for Grafana:
The default port for Grafana is 3000.
You will be presented with this screen when launching the application for the first time.

The default login for Grafana is ‘admin’ and the default password is also ‘admin’.
When setting those credentials, you will be asked to change your password.

Choose a password, and click on ‘Save‘.
You should now be presented with the default screen for Grafana v6.2.
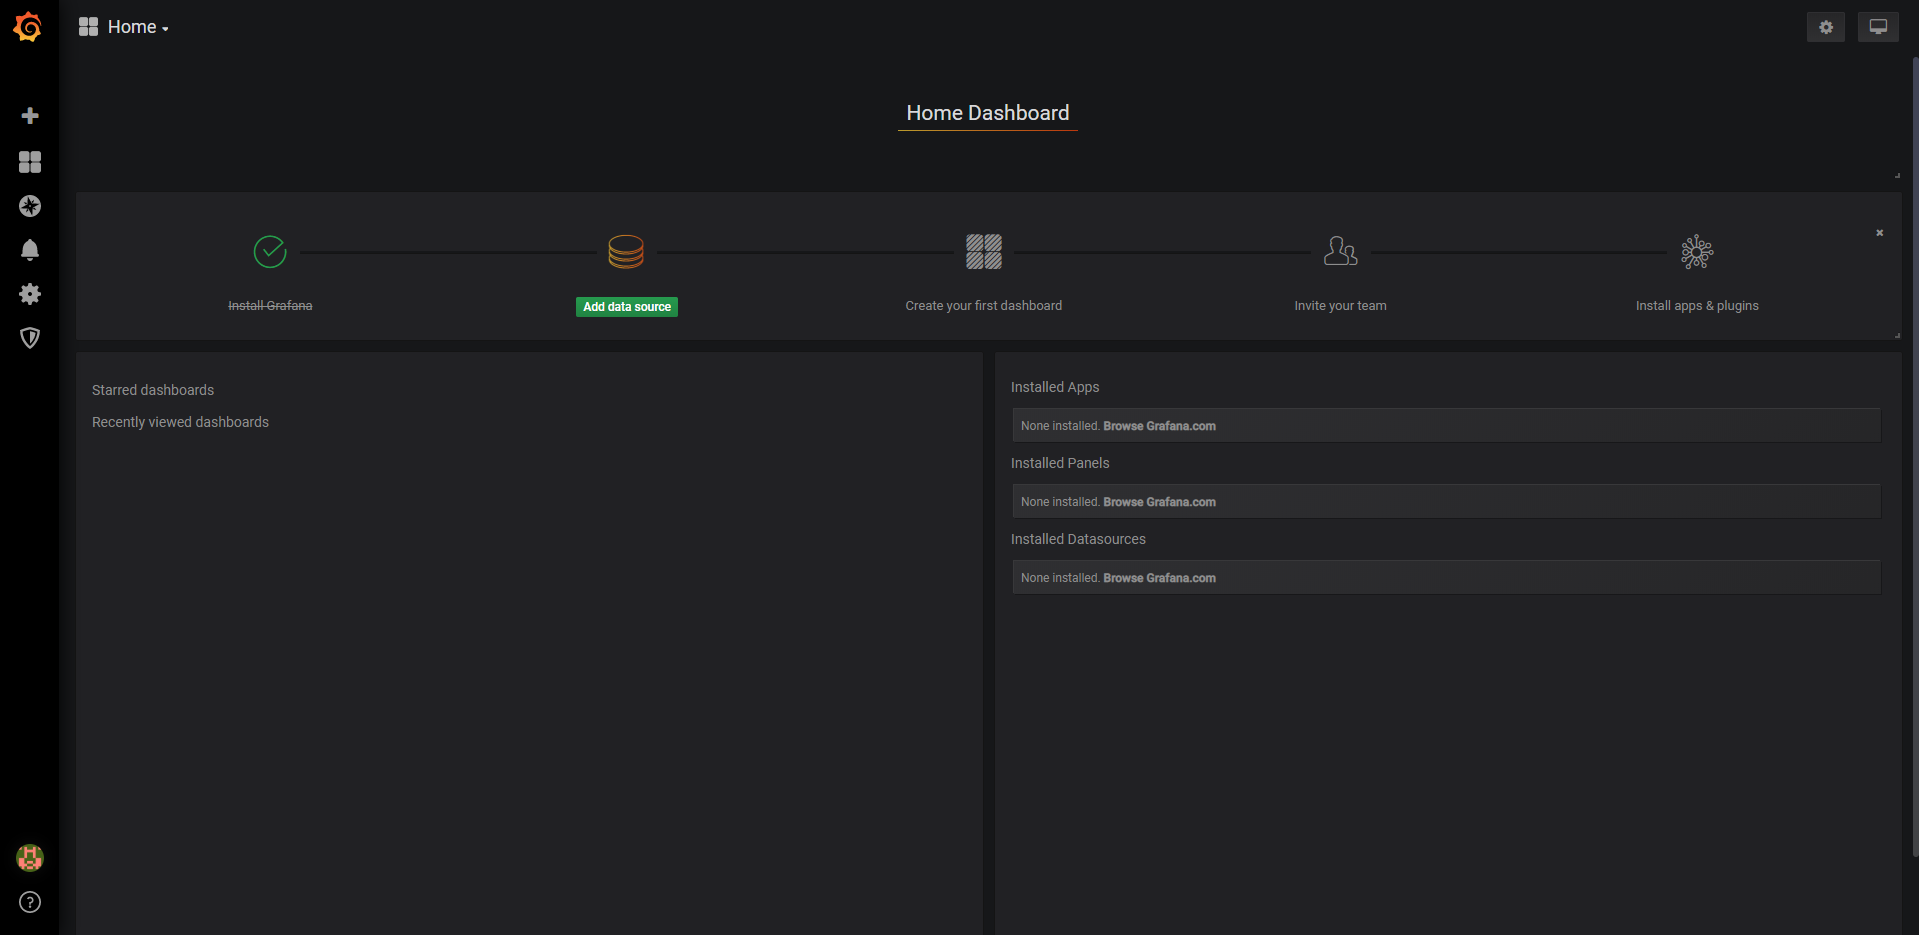
Before configuring any datasource for our new Grafana server, we can going to perform some mandatory steps in order to make sure that our Grafana is secure.
7. Disable anonymous access
If you are using Grafana for personal usage only, you are not concerned about restricting the access to anonymous users.
However, if you are running on production, you may want to restrict dashboards so that only authenticated users can see and modify them.
To configure this behaviour, we are going to disable anonymous access on our Grafana server.
Navigate to your Grafana configuration file (as a reminder, located at /etc/grafana/grafana.ini if you kept default settings).
$ sudo vi /etc/grafana/grafana.iniSearch for the [auth.anonymous] section in the configuration file (using vi)
(in Vi) ?[auth-anonymous]
#################################### Anonymous Auth ##########################
[auth.anonymous]
# enable anonymous access
enabled = true

# specify organization name that should be used for unauthenticated users
org_name = Main Org.

# specify role for unauthenticated users
org_role = Viewer
Set the enabled parameter to false, close your file, and restart your Grafana server.
(in Vi) :wq!
$ sudo systemctl restart grafana-server
$ sudo systemctl status grafana-server
To verify that anonymous access was correctly removed, try to directly access the URL of a dashboard.
You should be redirected to the initial login page.

8. Disable new user registrations
The account that you created when you first launched your server will be used as an administrator account for your server.
However, in order to prevent unallowed access, you may want to disable user registration.
Natively, user registration is available at http://localhost:3000/signup

To disable user registration, head back to your configuration file, and disable the following section.
$ sudo vi /etc/grafana/grafana.ini
(in Vi) ?[users]

[users]
# disable user signup / registration
;allow_sign_up = true

# Allow non admin users to create organizations
;allow_org_create = true

# Set to true to automatically assign new users to the default organization (id 1)
;auto_assign_org = true
Change the allow_sign_up setting to false, and restart your Grafana server.
;allow_sign_up = false
$ sudo systemctl restart grafana-server
Now that user registration is disabled, head over to http://localhost:3000/signup and try to create an account.
You should see the following box on the top right corner of your screen.
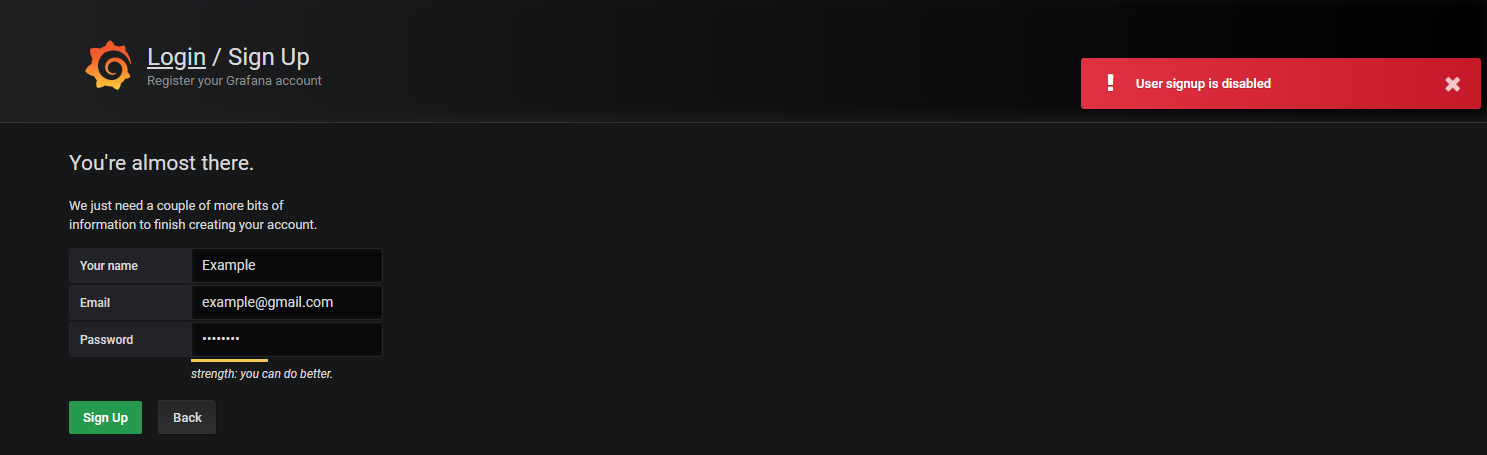
Great! Now anonymous users cannot create an account without your administrative consent.
9. Allow your firewall ports
If you are using a firewall on your Ubuntu machine, you should open the port 3000 in order to connect to it remotely.
To do it, run the following command:
$ sudo ufw allow 3000If you want more custom firewall rules, you can read this tutorial on opening firewall ports.
Congratulations! You know how to install Grafana on Ubuntu 18.04 and how to configure it properly.
Going Further
Now that your Grafana server is up and ready, it is time for you to start playing with it.
On devconnected, we already have plenty of resources where Grafana is used as a first class citizen.
If you need some inspiration, here are some detailed guides using the latest versions of Grafana:
- Monitoring Linux Processes using Grafana and Prometheus (with multiple bar gauges available)
- Monitoring Disk I/O on Linux with the Node Exporter and Grafana (with a futuristic theme!)
- Geolocating SSH hackers in real time with Grafana and InfluxDB
If you are looking for more resources related to Grafana installation, make sure to read the official docs on the subject.
Also, you can check on datasources documentation pages if you want to add a datasource to your Grafana instance. Here’s an example for InfluxDB.
I hope that you learned something new today.
If that’s the case, make sure to leave a comment, or to share this article, it always helps.
Until then, have fun, as always.
9 comments
[…] How To Install Grafana on Ubuntu 18.04 […]
[…] How To Install Grafana on Ubuntu 18.04 […]
[…] How To Install Grafana on Ubuntu 18.04 […]
[…] How To Install Grafana on Ubuntu 18.04 […]
Hi,
If I run “sudo apt-get install grafana” I get a message that it cannot find the package grafana!
I am running a 32 bits version of ubuntu 18.04.3 LTS on a ATOM 270 powered netbook. Unfortunately a 64 bits ubuntu is not possible on this old machine.
Any ideas?
Hello,
Have you correctly added the grafana repository to your apt package list?
That’s actually not mentioned directly in the tutorial.
sudo add-apt-repository “deb https://packages.grafana.com/oss/deb stable main”
This was awesome. Appreciate it.
you forgot to add the step to add the rafana repository
add-apt-repository “deb https://packages.grafana.com/oss/deb stable main”