This article focuses on installing the latest version of Grafana on an Ubuntu 20.04 server.
Recently, Grafana Labs released a brand new version of Grafana : v7.0
This new version featured a whole set of different features : namely a new panel editor, a new explore function as well as new plugins and tutorials for beginners.
As Grafana evolves a lot since our last tutorial, it is time for us to update the Grafana installation guide for Ubuntu 20.04.
In this tutorial, you will learn how you can install and configure a Grafana instance for your Ubuntu server.
Looking to install Grafana on CentOS/RHEL, we have tutorials for other distributions.
Prerequisites
In order to install Grafana, you will need to have sudo privileges on your instance.
To verify that this is the case, you can run the “groups” command and verify that “sudo” is part of the secondary groups.
$ groups
If you are not sure about the method to get sudo rights on Ubuntu, you can check our dedicated guide on the subject.
Now that you have the correct rights, it is time to link your instance to the Grafana repositories.
1. Add the Grafana repositories to your server
First of all, you need to add the Grafana APT repositories in order to be able to install packages from them.
If you already have Grafana repositories, you can skip this section and go to the next one.
First, install packages that are needed for Grafana to run properly : apt-transport and software-properties-common.
$ sudo apt-get install -y apt-transport-https
$ sudo apt-get install -y software-properties-common wget
Add the GPG key to the trusted keys
In order to retrieve Grafana packages in a secure way, you need to add the GPG key to your trusted set of keys.
To achieve that, you need to use the “apt-key“ command.
$ wget -q -O - https://packages.grafana.com/gpg.key | sudo apt-key add -

OK
A simple “OK” confirmation should be displayed right after the command.
Add the trusted Grafana repositories
Now that everything is configured, you can add the Grafana repositories to the custom APT repositories of your server.
$ echo "deb https://packages.grafana.com/oss/deb stable main" | sudo tee -a /etc/apt/sources.list.d/grafana.list

deb https://packages.grafana.com/oss/deb stable main
Awesome, now you can update your distribution packages and verify that it links to the Grafana repositories.

To install Grafana, use the “apt-get install” command.
$ sudo apt-get install grafana
Congratulations, you successfully installed the new Grafana v7.0 on your Ubuntu machine!
However, by default, your Grafana server is not started. You will have to configure it and start it manually, which is the purpose of the following sections.
2. Inspect your grafana-server systemd service
If you are using systemd, Grafana created for you a service called “grafana-server“.
To make sure of it, you can run the following command.
$ sudo ls /usr/lib/systemd/system/grafana-server.service

$ cat /usr/lib/systemd/system/grafana-server.service

[Unit]
Description=Grafana instance
Documentation=http://docs.grafana.org
Wants=network-online.target
After=network-online.target
After=postgresql.service mariadb.service mysql.service

[Service]
EnvironmentFile=/etc/default/grafana-server
User=grafana
Group=grafana
Type=simple
Restart=on-failure
WorkingDirectory=/usr/share/grafana
RuntimeDirectory=grafana
RuntimeDirectoryMode=0750
ExecStart=/usr/sbin/grafana-server                                                  \
                            --config=${CONF_FILE}                                   \
                            --pidfile=${PID_FILE_DIR}/grafana-server.pid            \
                            --packaging=deb                                         \
                            cfg:default.paths.logs=${LOG_DIR}                       \
                            cfg:default.paths.data=${DATA_DIR}                      \
                            cfg:default.paths.plugins=${PLUGINS_DIR}                \
                            cfg:default.paths.provisioning=${PROVISIONING_CFG_DIR}


LimitNOFILE=10000
TimeoutStopSec=20
UMask=0027
[Install]
WantedBy=multi-user.target
It is quite important for you to inspect this file, as it provides many information about the server that you just installed.
From the file, you understand that :
- The Grafana server binary is located at /usr/sbin/grafana-server.
- The file that defines all the environment variables is located at /etc/default/grafana-server
- The configuration file is given via the CONF_FILE environment variable.
- The PID of the file is also determined by the PID_FILE_DIR environment variable.
- Logging, data, plugins and provisioning paths are given by environment variables.
The content of the environment file is the following one :
GRAFANA_USER=grafana

GRAFANA_GROUP=grafana

GRAFANA_HOME=/usr/share/grafana

LOG_DIR=/var/log/grafana

DATA_DIR=/var/lib/grafana

MAX_OPEN_FILES=10000

CONF_DIR=/etc/grafana

CONF_FILE=/etc/grafana/grafana.ini

RESTART_ON_UPGRADE=true

PLUGINS_DIR=/var/lib/grafana/plugins

PROVISIONING_CFG_DIR=/etc/grafana/provisioning

# Only used on systemd systems
PID_FILE_DIR=/var/run/grafana
3. Start your grafana-server service
Now that you have learnt about the Grafana configuration variables and how you can arrange your Grafana server, it is time to launch your service.
In order to start your service, you need to execute the “systemctl start” command on the “grafana-server” service.
$ sudo systemctl start grafana-server
$ sudo systemctl status grafana-server
If your service is set as “Active” and “Loaded” (meaning that it will be started on launch), you should be good to go!
Now that everything is configured, we are going to head over to the Web UI in order to create your first dashboard.
4. Launch Grafana v7 Web UI
To open Grafana, you need to open a web browser and navigate to http://localhost:3000.
As a reminder, Grafana works on port 3000 by default, but it may be different if you are already using this port.
You will be presented with this screen when launching the application for the first time.

By default, the login for Grafana is “admin” and the default password is also “admin“.
You will be asked to change your password via a custom chosen password or a strong generated one.

Choose a password and click on “Submit“.
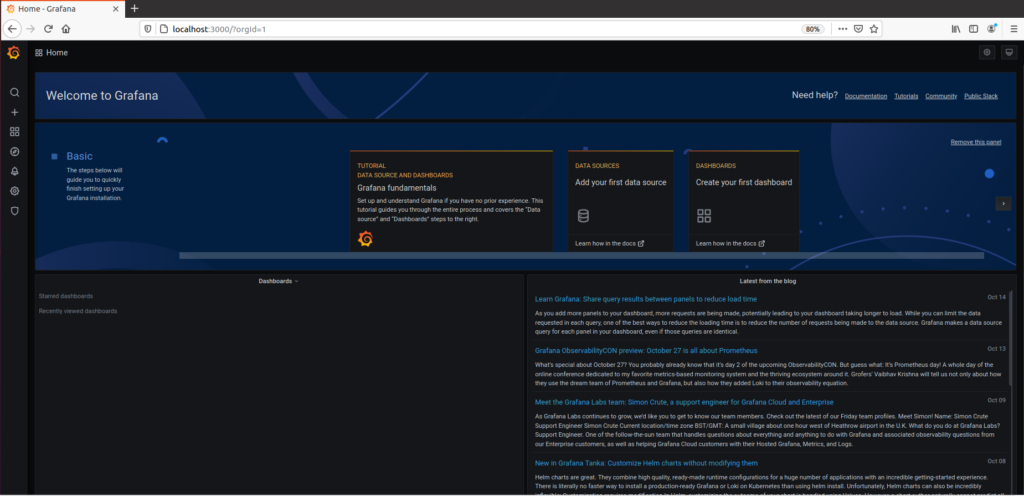
You should now be presented with the default screen for Grafana v7.0, well different from the v6.2 one!

If you are new to Grafana, you should probably follow the tutorial showcased on the “Welcome page“.
Disable new user registrations
The account that you just created will be used as an administrator account for your server.
However, in some cases, you want to be the only one responsible for new user registrations on your server.
That’s why you should think about disabling new user registrations.
By default, user registration is available at http://localhost:3000/signup.

To disable user registration, head back to the configuration file and disable the following section.
$ sudo vi /etc/grafana/grafana.ini

### Content of grafana configuration file

[users]
# disable user signup / registration
;allow_sign_up = true

# Allow non admin users to create organizations
;allow_org_create = true

# Set to true to automatically assign new users to the default organization (id 1)
;auto_assign_org = true
Change the allow_sign_up setting to false, and restart your Grafana server.
;allow_sign_up = false

$ sudo systemctl restart grafana-server
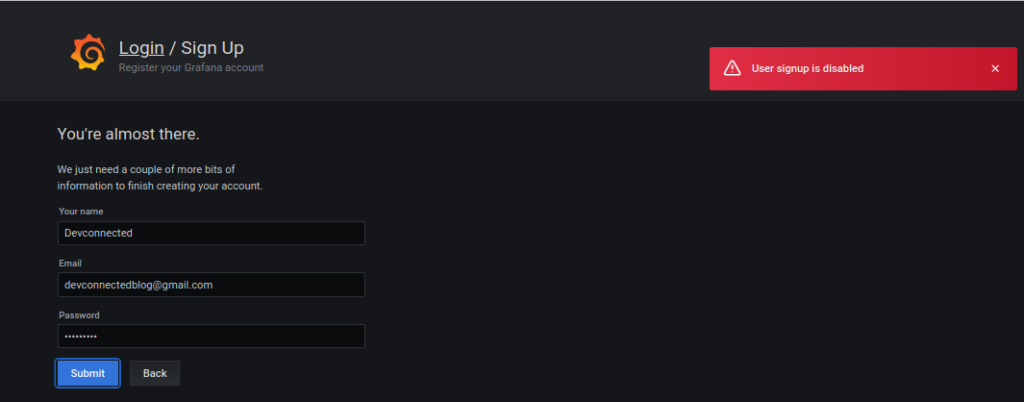
Now you can test that user registration is correctly disabled on your server.
Note that the page will still be accessible but you will be prompted with an error message when you try to create a new user.

Awesome, you successfully disabled user registration on your server!
Start monitoring targets with Grafana
Using Grafana alone is not very useful but you can connect it to many different data sources.
In Grafana, data sources are defined as plugins that one can install in order to connect to it.
On modern architectures, one can connect to cloud datasources like Cloudwatch or Amazon Timestream.
If you are using InfluxDB or Prometheus, note that we wrote tutorials about it on how to setup Grafana with Telegraf and InfluxDB.
The possibilities with those tools are infinite : you can setup a Windows server monitoring or a realtime process monitoring, it is up to you.
Create Your First Dashboard
In order to create all those monitoring dashboards, you will need to create a simple dashboard first.
If you are new to Grafana dashboards, we wrote an extensive guide on how to create Grafana dashboard, so make sure to check it out!


1 comment
[…] How To Install Grafana on Ubuntu 20.04 – devconnected […]