
This tutorial details how to build a monitoring pipeline to analyze Linux logs with ELK 7.2 and Rsyslog.
If you are a system administrator, or even a curious application developer, there is a high chance that you are regularly digging into your logs to find precious information in them.
Sometimes you may want to monitor SSH intrusions on your VMs.
Sometimes, you might want to see what errors were raised by your application server on a certain day, on a very specific hour. Or you may want to have some insights about who stopped your systemd service on one of your VMs.
If you pictured yourself in one of those points, you are probably on the right tutorial.
In this tutorial, we are to build a complete log monitoring pipeline using the ELK stack (ElasticSearch, Logstash and Kibana) and Rsyslog as a powerful syslog server.
Before going any further, and jumping into technical considerations right away, let’s have a talk about why do we want to monitor Linux logs with Kibana.
I – Why should you monitor Linux logs?
Monitoring Linux logs is crucial and every DevOps engineer should know how to do it. Here’s why :
- You have real-time visual feedback about your logs : probably one of the key aspects of log monitoring, you can build meaningful visualizations (such as datatables, pies, graphs or aggregated bar charts) to give some meaning to your logs.
- You are able to aggregate information to build advanced and more complex dashboards : sometimes raw information is not enough, you may want to join it with other logs or to compare it with other logs to identify a trend. A visualization platform with expression handling lets you perform that.
- You can quickly filter for a certain term, or given a certain time period : if you are only interested in SSH logs, you can build a targeted dashboard for it.
- Logs are navigable in a quick and elegant way : I know the pain of tailing and greping your logs files endlessly. I’d rather have a platform for it.

II – What You Will Learn
There are many things that you are going to learn if you follow this tutorial:
- How logs are handled on a Linux system (Ubuntu or Debian) and what rsyslog is.
- How to install the ELK stack (ElasticSearch 7.2, Logstash and Kibana) and what those tools will be used for.
- How to configure rsyslog to forward logs to Logstash
- How to configure Logstash for log ingestion and ElasticSearch storage.
- How to play with Kibana to build our final visualization dashboard.
The prerequisites for this tutorial are as follows :
- You have a Linux system with rsyslog installed. You either have a standalone machine with rsyslog, or a centralized logging system.
- You have administrator rights or you have enough rights to install new packages on your Linux system.
Without further due, let’s jump into it!
III – What does a log monitoring architecture looks like?
a – Key concepts of Linux logging
Before detailing how our log monitoring architecture looks like, let’s go back in time for a second.
Historically, Linux logging starts with syslog.
Syslog is a protocol developed in 1980 which aims at standardizing the way logs are formatted, not only for Linux, but for any system exchanging logs.
From there, syslog servers were developed and were embedded with the capability of handling syslog messages.
They rapidly evolved to functionalities such as filtering, having content routing abilities, or probably one of the key features of such servers : storing logs and rotating them.
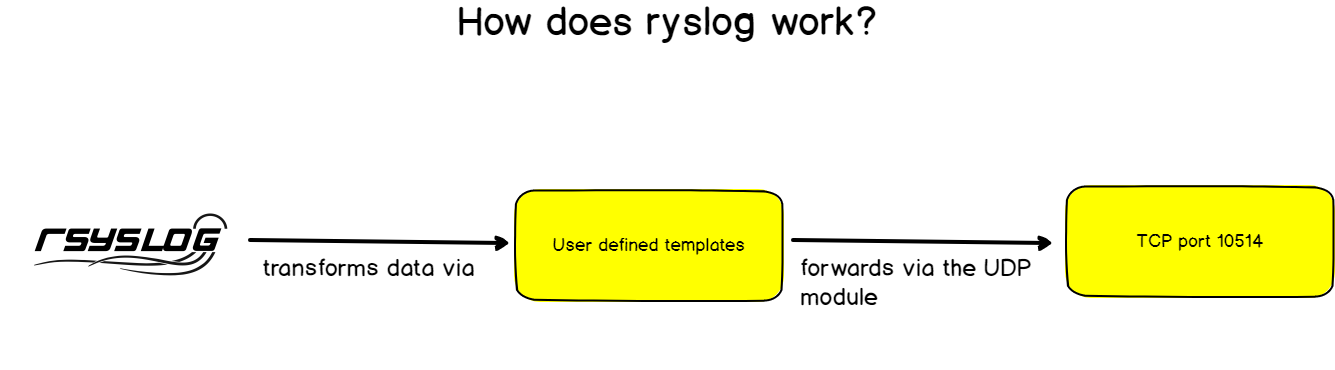
Rsyslog was developed keeping this key functionality in mind : having a modular and customizable way to handle logs.
The modularity would be handled with modules and the customization with log templates.
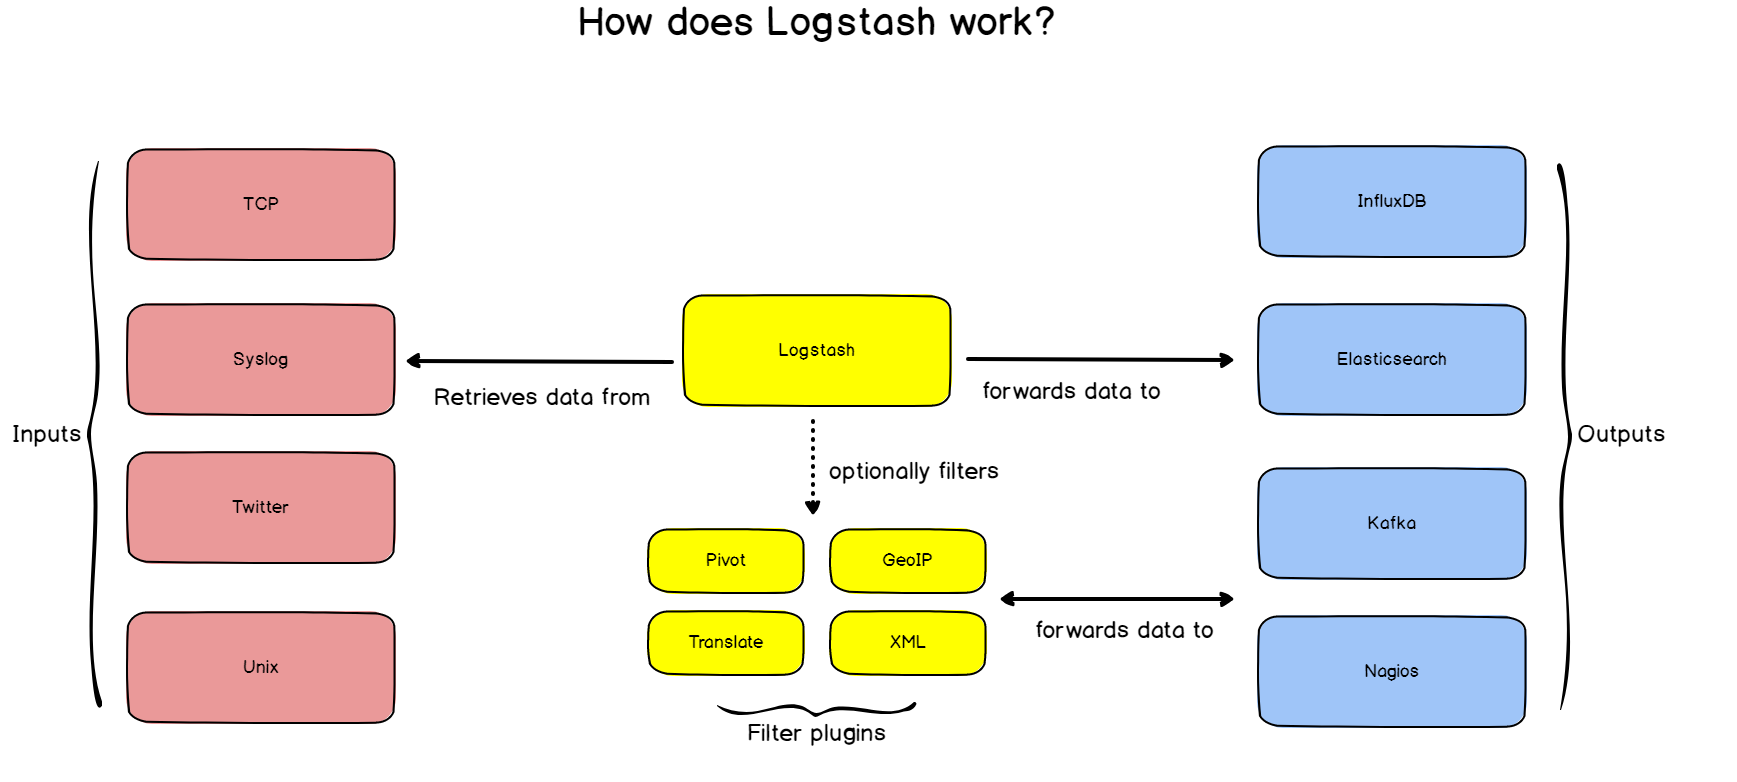
In a way, rsyslog can ingest logs from many different sources and it can forward them to an even wider set of destinations. This is what we are going to use in our tutorial.
b – Building a log monitoring architecture
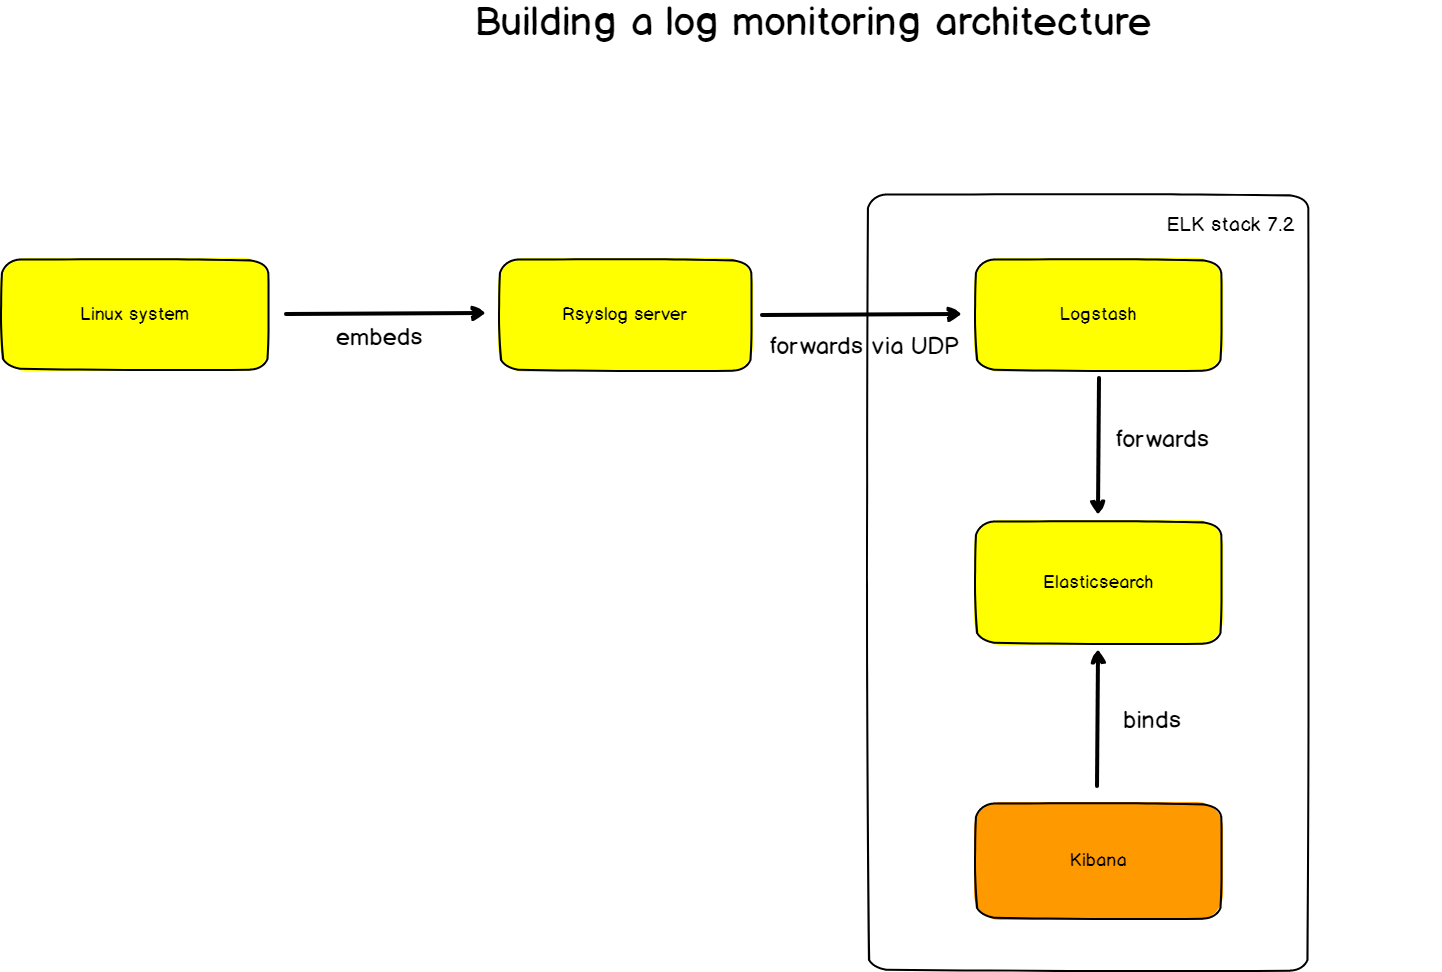
Here’s the final architecture that we are going to use for this tutorial.
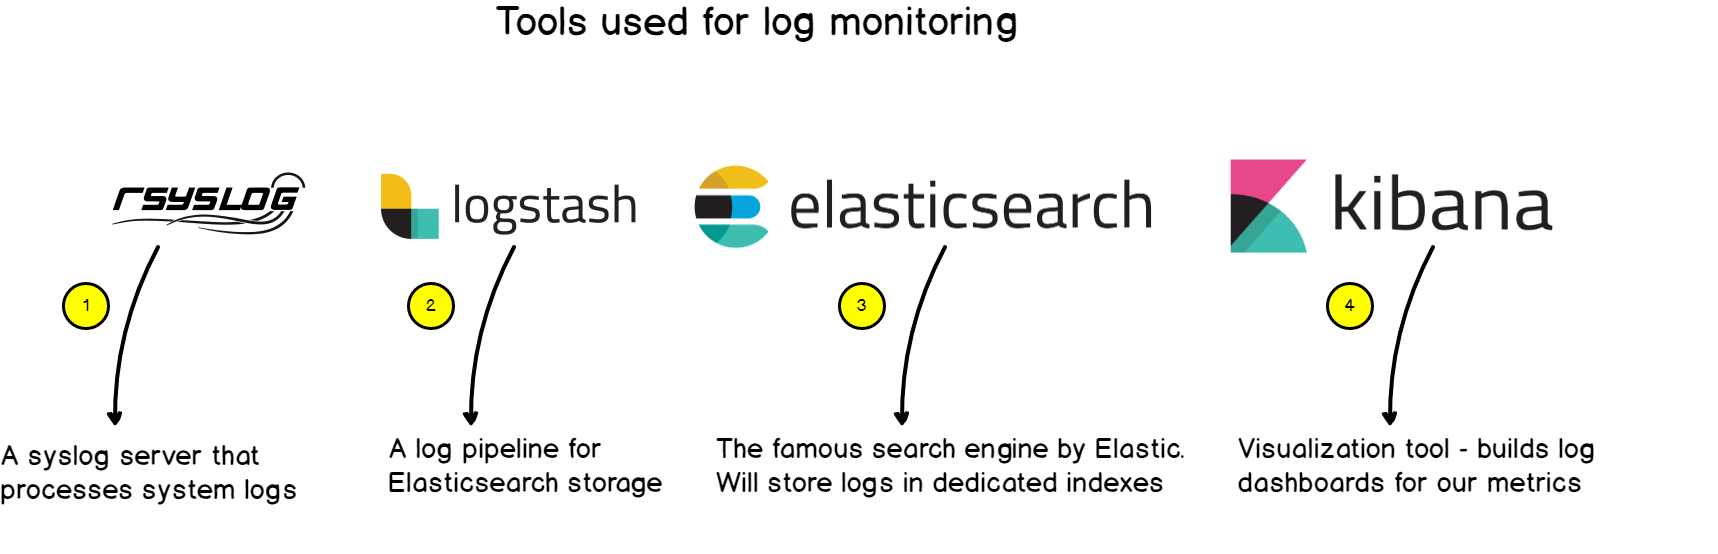
- rsyslog : used as an advancement syslog server, rsyslog will forward logs to Logstash in the RFC 5424 format we described before.
- Logstash : part of the ELK stack, Logstash will transform logs from the syslog format to JSON. As a reminder, ElasticSearch takes JSON as an input.
- ElasticSearch : the famous search engine will store logs in a dedicated log index (logstash-*). ElasticSearch will naturally index the logs and make them available for analyzing.
- Kibana : used as an exploration and visualization platform, Kibana will host our final dashboard.
Now that we know in which direction we are heading, let’s install the different tools needed.
IV – Installing The Different Tools

a – Installing Java on Ubuntu
Before installing the ELK stack, you need to install Java on your computer.
To do so, run the following command:
$ sudo apt-get install default-jreAt the time of this tutorial, this instance runs the OpenJDK version 11.
ubuntu:~$ java -version
openjdk version "11.0.3" 2019-04-16
OpenJDK Runtime Environment (build 11.0.3+7-Ubuntu-1ubuntu218.04.1)
OpenJDK 64-Bit Server VM (build 11.0.3+7-Ubuntu-1ubuntu218.04.1, mixed mode, sharing)
b – Adding Elastic packages to your instance
For this tutorial, I am going to use a Ubuntu machine but details will be given for Debian ones.
First, add the GPG key to your APT repository.
$ wget -qO - https://artifacts.elastic.co/GPG-KEY-elasticsearch | sudo apt-key add -Then, you can add Elastic source to your APT source list file.
$ echo "deb https://artifacts.elastic.co/packages/7.x/apt stable main" | sudo tee -a /etc/apt/sources.list.d/elastic-7.x.list

$ cat /etc/apt/sources.list.d/elastic-7.x.list
deb https://artifacts.elastic.co/packages/7.x/apt stable main

$ sudo apt-get update
From there, you should be ready to install every tool in the ELK stack.
Let’s start with ElasticSearch.
c – Installing ElasticSearch
ElasticSearch is a search engine built by Elastic that stores data in indexes for very fast retrieval.
To install it, run the following command:
$ sudo apt-get install elasticsearchThe following command will automatically :
- Download the deb package for ElasticSearch;
- Create an elasticsearch user;
- Create an elasticsearch group;
- Automatically create a systemd service fully configured (inactive by default)
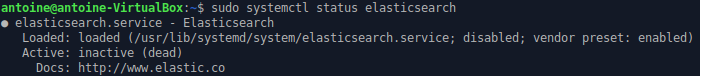
On first start, the service is inactive, start it and make sure that everything is running smoothly.
$ sudo systemctl start elasticsearch
● elasticsearch.service - Elasticsearch
   Loaded: loaded (/usr/lib/systemd/system/elasticsearch.service; disabled; vendor preset: enabled)
   Active: active (running) since Mon 2019-07-08 18:19:45 UTC; 2 days ago
     Docs: http://www.elastic.co
In order to make sure that ElasticSearch is actually running, you can execute one of those two commands:
- Watching which applications listen on a targeted port
$ sudo lsof -i -P -n | grep LISTEN | grep 9200
java      10667   elasticsearch  212u  IPv6 1159208890      0t0  TCP [::1]:9200 (LISTEN)
java 10667 elasticsearch 213u IPv6 1159208891 0t0 TCP 127.0.0.1:9200 (LISTEN)- Executing a simple ElasticSearch query
$ curl -XGET 'http://localhost:9200/_all/_search?q=*&pretty'Your ElasticSearch instance is all set!
Now, let’s install Logstash as our log collection and filtering tool.
d – Installing Logstash
If you added Elastic packages previously, installing Logstash is as simple as executing:
$ sudo apt-get install logstashAgain, a Logstash service will be created, and you need to activate it.
$ sudo systemctl status logstash
$ sudo systemctl start logstash
By default, Logstash listens for metrics on port 9600. As we did before, list the open ports on your computer looking for that specific port.
$ sudo lsof -i -P -n | grep LISTEN | grep 9600
java      28872        logstash   79u  IPv6 1160098941      0t0  TCP 127.0.0.1:9600 (LISTEN)
Great!
We only need to install Kibana for our entire setup to be complete.
e – Installing Kibana
As a reminder, Kibana is the visualization tool tailored for ElasticSearch and used to monitor our final logs.
Not very surprising, but here’s the command to install Kibana:
$ sudo apt-get install kibanaAs usual, start the service and verify that it is working properly.
$ sudo systemctl start kibana
$ sudo lsof -i -P -n | grep LISTEN | grep 5601
node       7253          kibana   18u  IPv4 1159451844      0t0  TCP *:5601 (LISTEN)
Kibana Web UI is available on port 5601.
Head over to http://localhost:5601 with your browser and you should see the following screen.
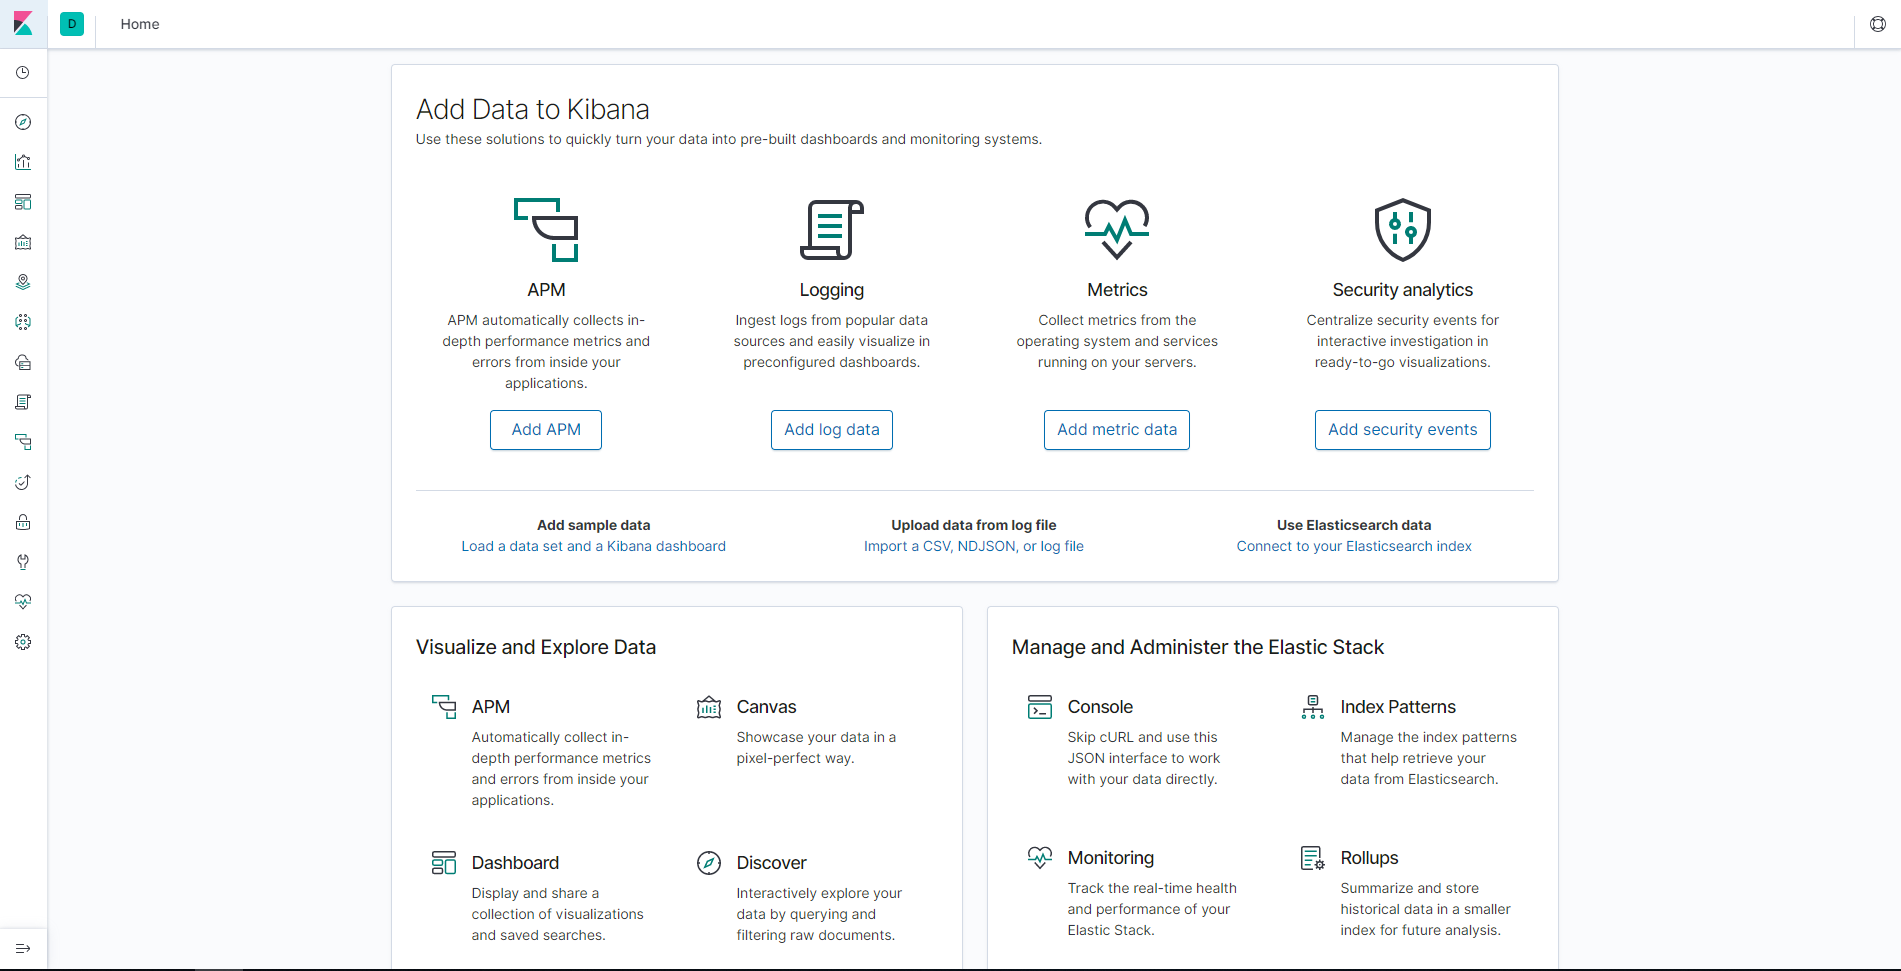
Nice!
We are now very ready to ingest logs from rsyslog and to start visualizing them in Kibana.
V – Routing Linux Logs to ElasticSearch
As a reminder, we are routing logs from rsyslog to Logstash and those logs will be transferred to ElasticSearch pretty much automatically.
a – Routing from Logstash to ElasticSearch
Before routing logs from rsyslog to Logstash, it is very important that we setup log forwarding between Logstash and ElasticSearch.
To do so, we are going to create a configuration file for Logstash and tell it exactly what to do.
To create Logstash configuration files, head over to /etc/logstash/conf.d and create a logstash.conf file.
Inside, append the following content:
input {
  udp {
    host => "127.0.0.1"
    port => 10514
    codec => "json"
    type => "rsyslog"
  }
}


# The Filter pipeline stays empty here, no formatting is done.                                                                                           filter { }


# Every single log will be forwarded to ElasticSearch. If you are using another port, you should specify it here.
output {
  if [type] == "rsyslog" {
    elasticsearch {
      hosts => [ "127.0.0.1:9200" ]
    }
  }
}
Note : for this tutorial, we are using the UDP input for Logstash, but if you are looking for a more reliable way to transfer your logs, you should probably use the TCP input. The format is pretty much the same, just change the UDP line to TCP.
Restart your Logstash service.
$ sudo systemctl restart logstashTo verify that everything is running correctly, issue the following command:
$ netstat -na | grep 10514
udp        0      0 127.0.0.1:10514         0.0.0.0:*
Great!
Logstash is now listening on port 10514.
b – Routing from rsyslog to Logstash
As described before, rsyslog has a set of different modules that allow it to transfer incoming logs to a wide set of destinations.
Rsyslog has the capacity to transform logs using templates. This is exactly what we are looking for as ElasticSearch expects JSON as an input, and not syslog RFC 5424 strings.
In order to forward logs in rsyslog, head over to /etc/rsyslog.d and create a new file named 70-output.conf
Inside your file, write the following content:
# This line sends all lines to defined IP address at port 10514
# using the json-template format.

*.*                         @127.0.0.1:10514;json-template
Now that you have log forwarding, create a 01-json-template.conf file in the same folder, and paste the following content:
template(name="json-template"
  type="list") {
    constant(value="{")
      constant(value="\"@timestamp\":\"")     property(name="timereported" dateFormat="rfc3339")
      constant(value="\",\"@version\":\"1")
      constant(value="\",\"message\":\"")     property(name="msg" format="json")
      constant(value="\",\"sysloghost\":\"")  property(name="hostname")
      constant(value="\",\"severity\":\"")    property(name="syslogseverity-text")
      constant(value="\",\"facility\":\"")    property(name="syslogfacility-text")
      constant(value="\",\"programname\":\"") property(name="programname")
      constant(value="\",\"procid\":\"")      property(name="procid")
    constant(value="\"}\n")
}
As you probably guessed it, for every incoming message, rsyslog will interpolate log properties into a JSON formatted message, and forward it to Logstash, listening on port 10514.
Restart your rsyslog service, and verify that logs are correctly forwarded to ElasticSearch.
Note : logs will be forwarded in an index called logstash-*.
$ sudo systemctl restart rsyslog
$ curl -XGET 'http://localhost:9200/logstash-*/_search?q=*&pretty'
{
  "took": 2,
  "timed_out": false,
  "_shards": {
    "total": 1,
    "successful": 1,
    "skipped": 0,
    "failed": 0
  },
  "hits": {
    "total": {
      "value": 10000,
      "relation": "gte"
    },
    "max_score": 1,
    "hits": [
      {
        "_index": "logstash-2019.07.08-000001",
        "_type": "_doc",
        "_id": "GEBK1WsBQwXNQFYwP8D_",
        "_score": 1,
        "_source": {
          "host": "127.0.0.1",
          "severity": "info",
          "programname": "memory_usage",
          "facility": "user",
          "@timestamp": "2019-07-09T05:52:21.402Z",
          "sysloghost": "schkn-ubuntu",
          "message": "                                  Dload  Upload   Total   Spent    Left  Speed",
          "@version": "1",
          "procid": "16780",
          "type": "rsyslog"
        }
      }
    ]
  }
}
Awesome! We know have rsyslog logs directly stored in ElasticSearch.
It is time for us to build our final dashboard in Kibana.
VI – Building a Log Dashboard in Kibana
This is where the fun begins.
We are going to build the dashboard shown in the first part and give meaning to the data we collected.
Similarly to our article on Linux process monitoring, this part is split according to the different panels of the final dashboard, so feel free to jump to the section you are interested in.
a – A Few Words On Kibana
Head over to Kibana (on http://localhost:5601), and you should see the following screen.

If it is your first time using Kibana, there is one little gotcha that I want to talk about that took me some time to understand.
In order to create a dashboard, you will need to build visualizations. Kibana has two panels for this, one called “Visualize” and another called “Dashboard”
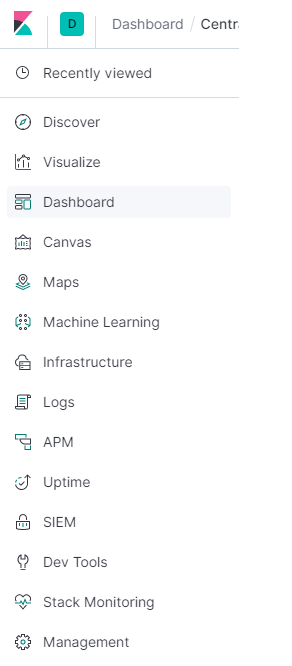
In order to create your dashboard, you will first create every individual visualization with the Visualize panel and save them.
When all of them will be created, you will import them one by one into your final dashboard.

Head over to the “Visualize” panel, and let’s start with one first panel.
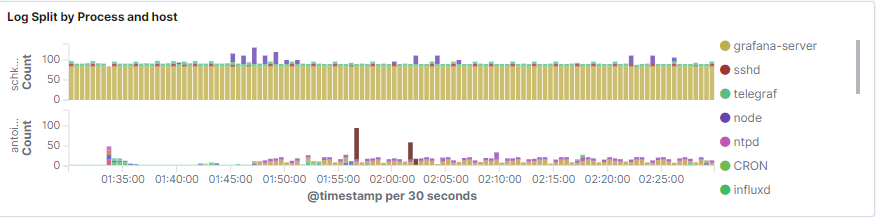
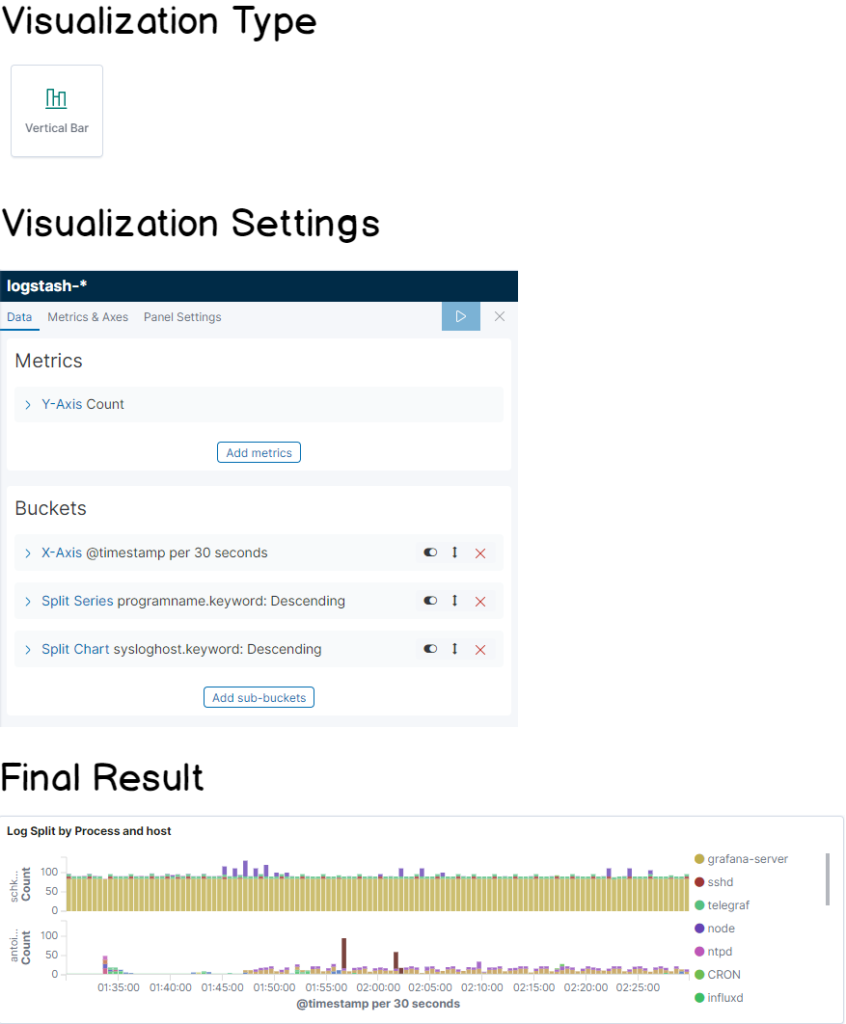
b – Aggregated bar chart for processes
To build your first dashboard, click on “Create new visualization” at the top right corner of Kibana. Choose a vertical bar panel.

The main goal is to build a panel that looks like this :
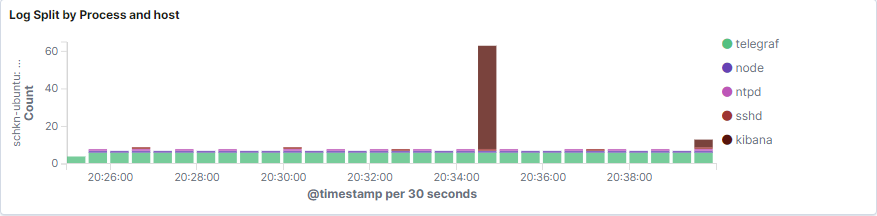
As you can see, the bar chart provides a total count of logs per processes, in an aggregated way.
The bar chart can also be split by host if you are working with multiple hosts.
Without further ado, here’s the cheatsheet for this panel.
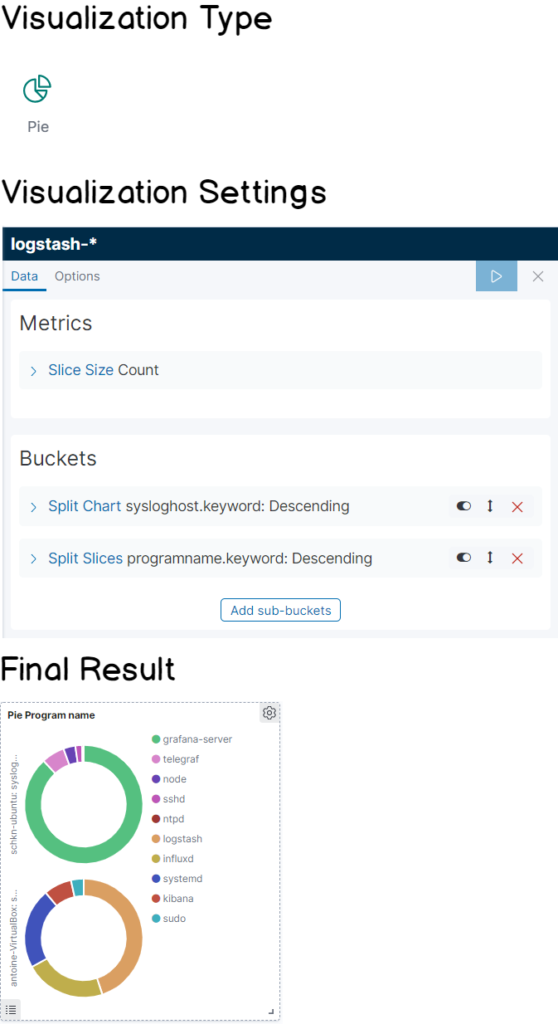
c – Pie by program name
Very similarly to what we have done before, the goal is to build a pie panel that divides the log proportions by program name.
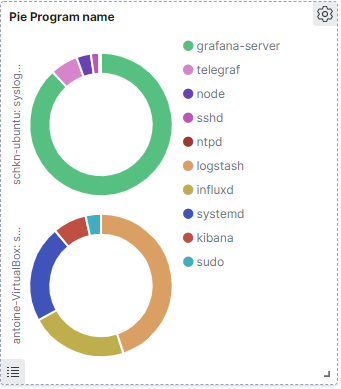
Here the cheatsheet for this panel!
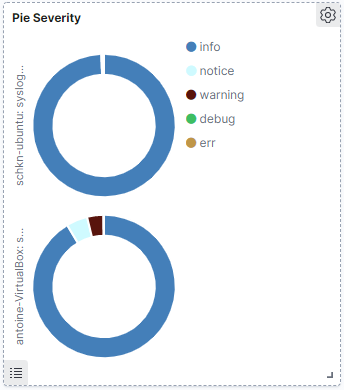
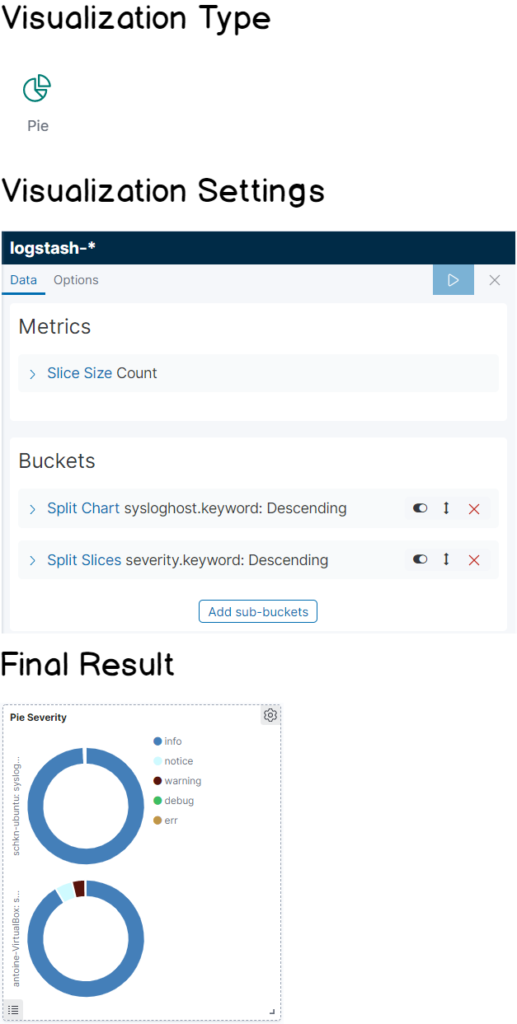
d – Pie by severity
This panel looks exactly like the one we did before, except that it splits logs by severity.
It can be quite useful when you have a major outage on one of your systems, and you want to quickly see that the number of errors is increasing very fast.
It also provides an easy way to see your log severity summary on a given period if you are interested for example in seeing what severities occur during the night or for particular events.
Again as you are probably waiting for it, here’s the cheatsheet for this panel!
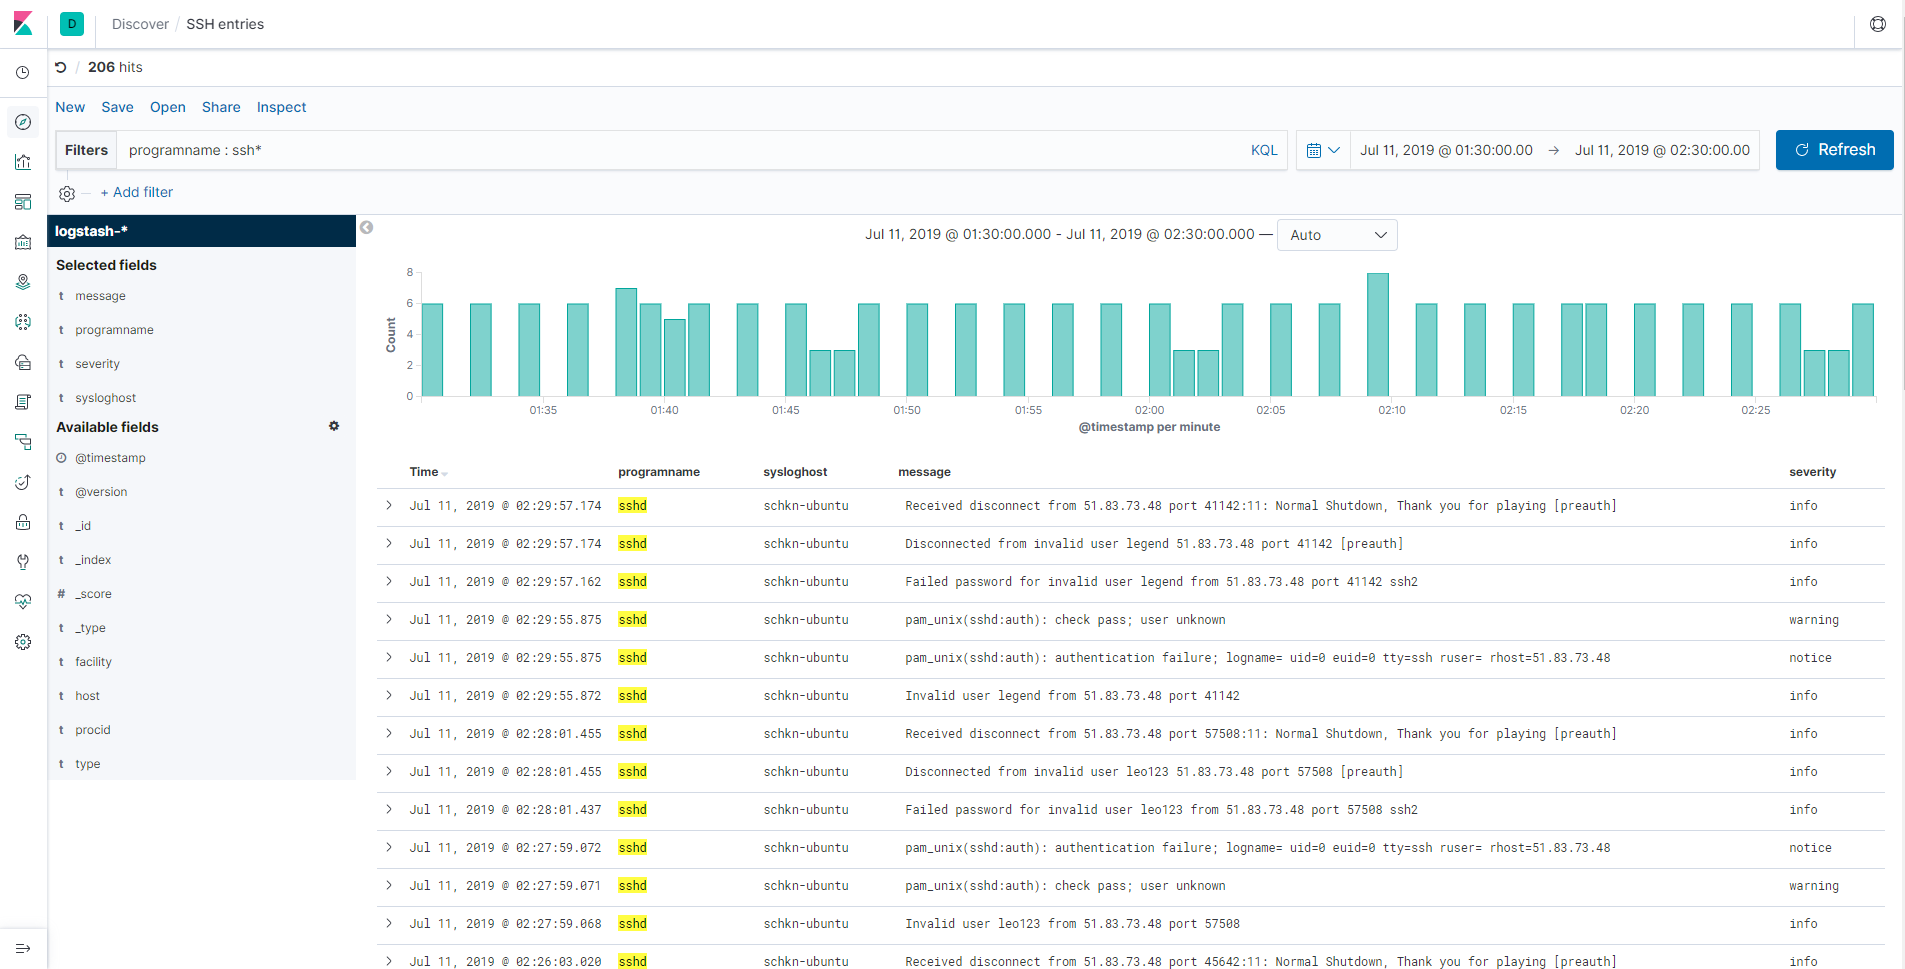
e – Monitoring SSH entries
This one is a little bit special, as you can directly go in the “Discover” tab in order to build your panel.
When entering the discover tab, your “logstash-*” should be automatically selected.
From there, in the filter bar, type the following filter “programname : ssh*”.
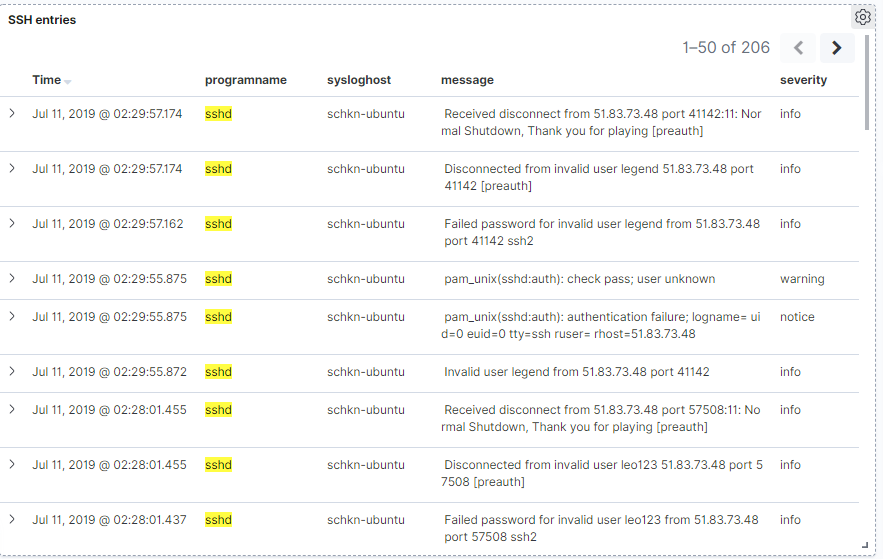
As you can see, you now have a direct access to every log related to the SSHd service on your machine. You can for example track illegal access attempts or wrong logins.
In order for it to be accessible in the dashboard panel, click on the “Save” option, and give a name to your panel.
Now in the dashboard panel, you can click on “Add”, and choose the panel you just created.
Nice! Now your panel is included into your dashboard, from the discover panel.
VI – Conclusion
With this tutorial, you know have a better understanding of how you can monitor your entire logging infrastructure easily with Rsyslog and the ELK stack.
With the architecture presented in this article, you can scale the log monitoring of an entire cluster very easily by forwarding logs to your central server.
One advice would be to use a Docker image for your rsyslog and ELK stack in order to be able to scale your centralized part (with Kubernetes for example) if the number of logs increases too much.
It is also important to note that this architecture is ideal if you choose to change the way your monitor logs in the future.
You can still rely on rsyslog for log centralizing, but you are free to change either the gateway (Logstash in this case), or the visualization tool.
It is important to note that you could use Grafana for example to monitor your Elasticsearch logs very easily.
With this tutorial, will you start using this architecture in your own infrastructure?
Do you think that other panels would be relevant for you to debug major outages on your systems?
If you have ideas, make sure to leave them below, so that it can help other engineers.
Until then, have fun, as always.
21 comments
> The bar chart can also be split by host if you are working with multiple hosts
Thanks for taking the time out to write this amazing walkthrough!
How would you go about adding multiple hosts to this dashboard? Which services would be needed to run on the remote hosts and their high level configuration modes?
The remote hosts are also using rsyslog but they are forwarding it to the central logging server, also running rsyslog but forwarding logs to Logstash.
I will write a walkthrough on how to build a centralized logging system, so you may want to check the blog soon 🙂
[…] Monitoring Linux Logs with Kibana and Rsyslog […]
[…] Monitoring Linux Logs with Kibana and Rsyslog […]
Nice tutorial. Following it, I hit a difference on Kibana which doesn’t listen to the outside world by default. In order to get your output and continue following your tut, I had to modify /etc/kibana/kibana.yml and uncomment the line that binds to localhost only, putting 0.0.0.0 in place of localhost.
Another couple of notes:
1. all the tests with curl you suggest don’t work, the reply I get is that logstash access control is preventing the requests. Had you disabled it?
2. Before you can use Kibana visualize you need to create an index pointing to logstash. I did that filling in the data best I could, but I would like to know if I did it right.
[…] Monitoring Linux Logs with Kibana and Rsyslog […]
Nice article, Antoine!
You mentioned in the beginning that we were going to use Logstash to convert syslog format to JSON (3.2.) but the actual conversion was done using rsyslog (5.2.); my questions are:
1. if we are not using Logstash to do conversion, why do we need it? we could just push JSON from rsyslog to ElasticSearch, right?
2. how do we convert syslog to JSON using Logstash?
Hello Max, and thank you for your questions.
1. Simple is always better, you could send logs directly from rsyslog to Elasticsearch using the omelasticsearch module of rsyslog. Here’s a link to it : https://www.rsyslog.com/doc/v8-stable/configuration/modules/omelasticsearch.html
2. Via a JSON codec, you can use this to encode messages from UDP or TCP to JSON. https://www.elastic.co/guide/en/logstash/current/plugins-codecs-json.html.
[…] Monitoring Linux Logs with Kibana and Rsyslog […]
Very nice write-up. Thanks for taking the time! Just wondering, why not use filebeat?
[…] Monitoring Linux Logs with Kibana and Rsyslog […]
I’ve been trying to get this set up but ran into some issue (not getting any output at all). Tracing this back I’ve found the problem is with rsyslog and specifically the output config.
When running the config checker it says the following:
rsyslogd: Could not find template 0 ‘json-template’ – action disabled [v8.16.0 try http://www.rsyslog.com/e/3003 ]
I’ve gone over the 01-json-template.conf file and the template name is certainly correct so I’m lost why it can’t find it.
Any suggestions?
Yep same folder for certain.
Is it possible the logic has changed slightly since the article was originally written? I can’t get to the bottom of this at all.
Great article! I did find one issue after setting it up; even though rsyslog is parsing log entries to JSON, it is still sending them with a newline to Logstash. About one quarter of my logs were being tagged with “_jsonparsefailure” and there were many ugly entries with lots of \\\\\\\\\\\\ in them.
I changed the Logstash input codec from “json” to “json_lines” and everything cleared up immediately.
Thank you for your input!
Very nice Article, guess will use it in our productive server environment. But there is only one question left which you can maybe answer. In our environment I need in addition the login entries in time from wtmp showing in kibana is that possible too ?
Its So Helpful . I am so experienced in ELK stack . I am search for a tutorial for syslog enabling and forwarding . This article helped me so much . Its worked 100% . Thank you so much SCHKN
I’m new to ELK, so I don’t know if you forgot to specify or since Kibana 9.3, but before adding items to the dashboard, you need to define an index pattern. https://www.elastic.co/guide/en/kibana/current/tutorial-define-index.html
Can we monitor linux users activities like login logout time as well as durations and what command used by them
Hey thank you for this nice tutorial. There is one thing: The ELK stack is not secured, when you activate SSL for the stack, logstash will deny the connection between rsyslog and it selve