
This article was originally published at The New Stack.
If you are a Windows Server Administrator or a power-user on Windows instances, you may have experienced the great sense of frustration that comes with services shutting down for no reason. The worst of it comes when you happen to discover it way too late leading to obvious useless costs for your team.
The goal of this tutorial is to put an end to that.
Together, we are going to build a complete stack for DevOps engineers to monitor Windows services and get alerts when one of them fails.
What You Will Learn
Before jumping right into the technical implementation, here’s the list of everything that you are going to learn if you follow the tutorial until the end :
- Get a grasp of a “classic” monitoring architecture and how tools interact together.
- Installing state of the art DevOps tools like Grafana v6.1.4 (released in 2019), InfluxDB v1.7.3 and Telegraf 1.10.3.
- Get to know what Performance Counters are and how to interact with the Performance Monitor.
- Build a complete dashboard with the last features of Grafana such as the gauge panel.
- Learn how alerts work with Grafana
Now that you know the skills that you are going to acquire, let’s have first a quick introduction about performance counters on Windows machines.
I – What Are Performance Counters?
Performance Counters on Windows machines are native components that record and monitor data for a variety of tools on your machine such as : your CPU, your disks, processes, databases (if you are running some, like MySQL) and even ASP.NET applications.
Windows exposes an API that any tool can query in order to retrive statistics from performance counters. Visual tools are also provided for you to take a look at metrics in real-time.
An example of a visual tool is the Performance Monitor, directly shipped on every Windows machine.
If you open the performance monitor, you can navigate to Monitoring Tools > Performance Monitor on the left menu. There, by clicking on the green add button, you are exposed to a set of high-levels metrics available on your computer.
Process, PhysicalDisk, LogicalDisk, Databases.. you can add metrics to the graph that is refresh periodically.
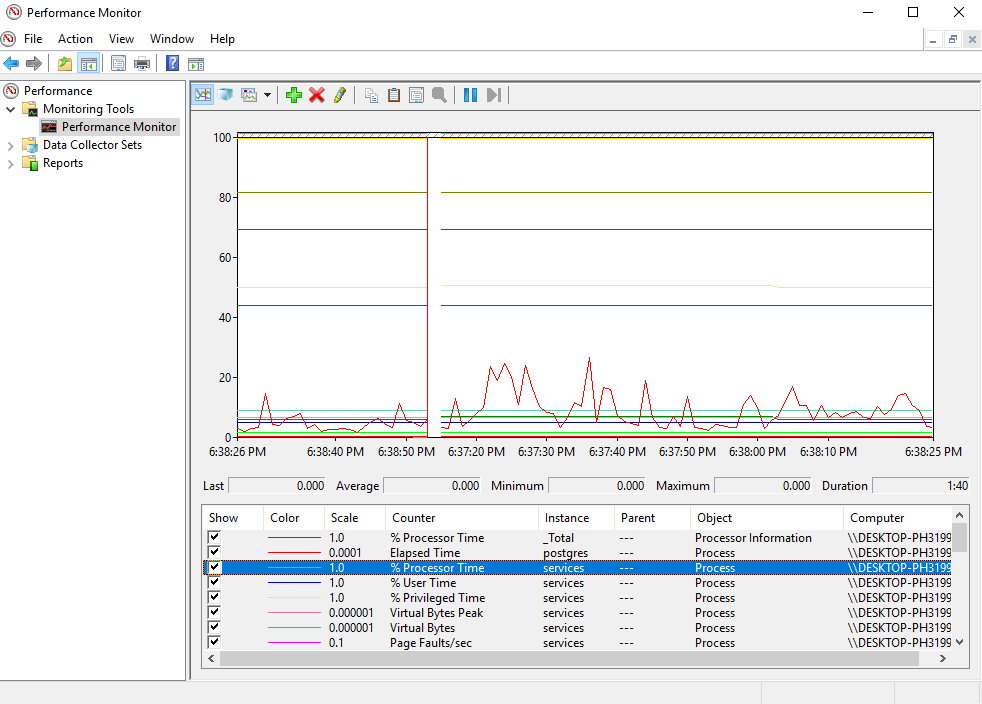
Playing with the Performance Monitor is already a good way to get a sense of what one can monitor. Before jumping right into Telegraf, you may want to experiment a bit with the Performance Monitor.
Now that you know a bit more about the Performance Counters, let’s have a look at how exactly we are going to build our monitoring architecture.
II – Building A Classic Monitoring Architecture
When building monitoring architectures for personal use, most of the time, you want to reunite three components :
- A monitoring agent : it can be Telegraf, CollectD, StatsD, Datadog or any tool that is able to gather metrics.
- A time series database : in this case InfluxDB but many others exist.
- A visualization tool : either Grafana or Chronograf.
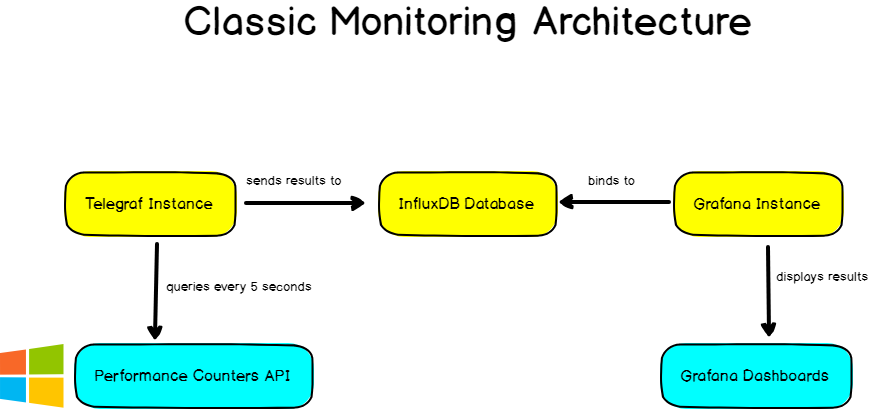
In this case, Telegraf will periodically queries the Windows Performance Counters API and send the results to InfluxDB. Those results will be accessible and explorable in Grafana.
III – Installing The Different Tools
Now that we know exactly what we are going to build, let’s install the different tools that we need.
a – Installing InfluxDB
Before configuring any monitoring agent, it is important to have a time series database first. Launching Telegraf without InfluxDB would result in many error messages that won’t be very relevant.
Installing InfluxDB is pretty straightforward, head over to https://portal.influxdata.com/downloads/ and save the resulting .zip somewhere on your computer.
When saved, unzip the content wherever you want, launch a command line and navigate to the folder where you stored your binaries (in my case, directly in Program Files). Once there, you will be presented with a couple of files :
- influx.exe : an CLI executable used to navigate in your databases and measurements easily.
- influxd.exe : used to launch an InfluxDB instance on your computer.
- influx_stress.exe : an executable used to run stress tests on your computer.
- influx_inspect : used to inspect InfluxDB disks and shards (not relevant in our case)
In our case, you want to run the influxd executable. Immediately after, you should see your InfluxDB instance running.
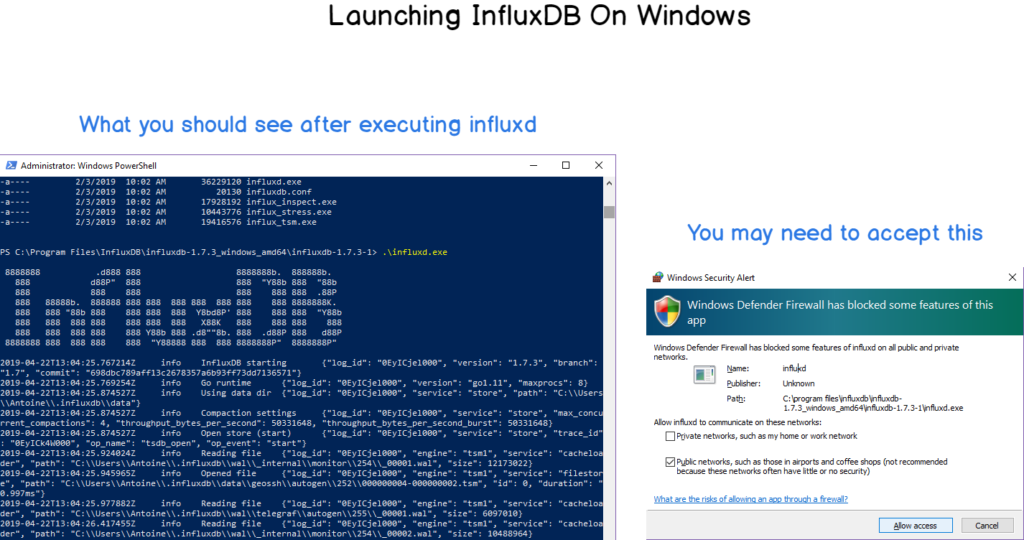
InfluxDB does not ship as a service yet, even if it is completely doable to configure it as a user-defined service on Windows.
b – Installing Telegraf
Telegraf’s installation on Windows can be a bit tricky.
To download Telegraf, head over the InfluxDB downloads page and click on the latest version of Telegraf available. https://portal.influxdata.com/downloads/
Telegraf installation should be done in the Program Files folder, in a folder named Telegraf.
Launch a Powershell instance as an administrator. Head over to the Program Files folder and run :
mkdir TelegrafDrop the executables downloaded here, and run :
telegraf.exe --service installAs a consequence, Telegraf should be installed as a service and available in Windows services. Telegraf configuration file should be configured to retrieve metrics from your CPU and disk. To test it, run :
net start telegrafIf everything is running okay, you should start seeing metrics aggregating in InfluxDB. To verify it, head over to InfluxDB folder (where you dropped your executables) and run influx.exe. You should be presented with a CLI, where you’ll type your first IFQL queries.
> show databases;
# You should see a list of your databases, including telegraf

> use telegraf;
# Navigating in your telegraf database

> show measurements;
# Getting the list of your measurements

> SELECT * FROM win_cpu
# Seeing your CPU metrics
If you are unfamiliar with basics of InfluxDB and what IFQL is, check my ultimate InfluxDB guide for beginners. It contains good explanations regarding everything that you need to know.
c – Installing Grafana
For this tutorial, we are going to use the brand new Grafana v6. Head over to Grafana download page, download the zip and unzip it wherever you want. Similarly to what you did with InfluxDB, head over to the folder where you stored your executables and run the Grafana server. (grafana-server.exe in bin folder)
By default, Grafana will run on port 3000. Default credentials are admin/admin (you are prompted to modify them directly at boot time).
When you’re done, you’ll be asked to configure your data sources. By default, an InfluxDB instance runs on port 8086. The following configuration should do the trick :
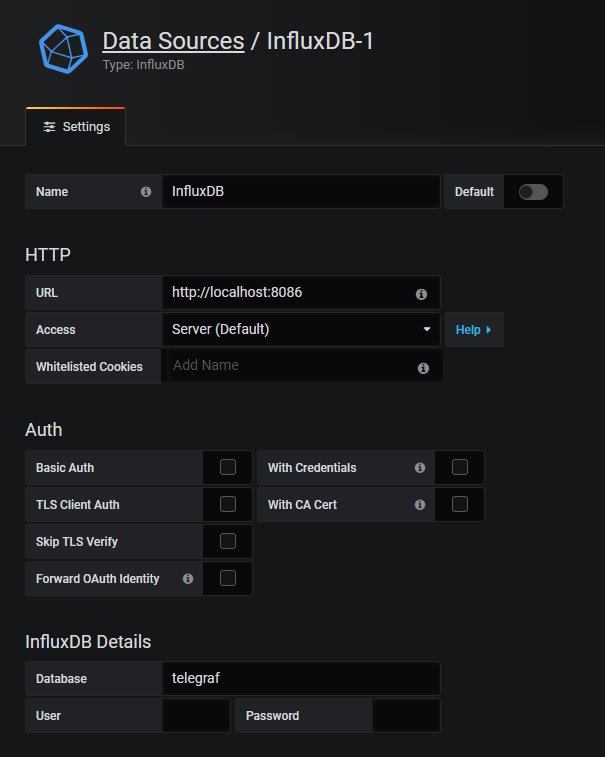
Now that all the tools are configured, it is time to start monitoring Windows services.
IV – Configuring Telegraf
Before creating our awesome dashboard, we need to configure Telegraf in order for it to query the Performance Counters API we described in the first chapter.
This will be done by using the win_perf_counters plugin of Telegraf. The plugin needs to be declared in the inputs section of your configuration file and looks like this :
[[inputs.win_perf_counters]]
  [[inputs.win_perf_counters.object]]
    # Processor usage, alternative to native, reports on a per core.
    ObjectName = "Processor"
    Instances = ["*"]
    Counters = ["% Idle Time", "% Interrupt Time", "% Privileged Time", "% User Time"]
    Measurement = "win_cpu"
The ObjectName property expects the exact same name that you would find the Performance Monitor. When in doubt about what you can query on Windows, you can either :
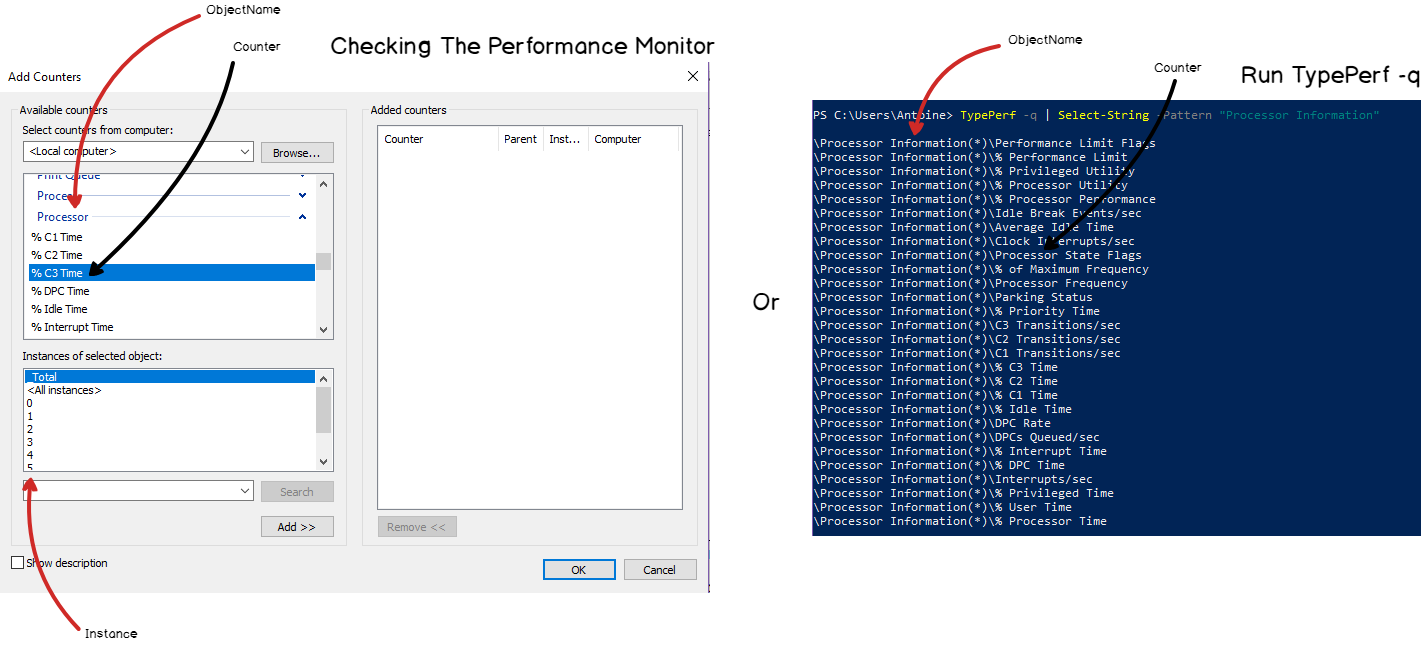
In our case, we want to monitor the Process object name, the ElapsedTime counter for the service we are interested in : postgres (for this example).
We can also add the ‘% Processor Time‘ metric in order to stop CPU-consuming resources.
The resulting Telegraf configuration will be :
[[inputs.win_perf_counters]]
  [[inputs.win_perf_counters.object]]
    # Processor usage, alternative to native, reports on a per core.
    ObjectName = "Process"
    Instances = ["*"]
    Counters = ["Elapsed Time", "% Processor Time"]
    Measurement = "win_services"
Now that everything is configured, let’s head over to Grafana and build our dashboard!
V – Building An Awesome Dashboard
This is where the fun begins. We are going to build our dashboard in Grafana v6.0.
As a reminder, this is the dashboard that we are going to build today.
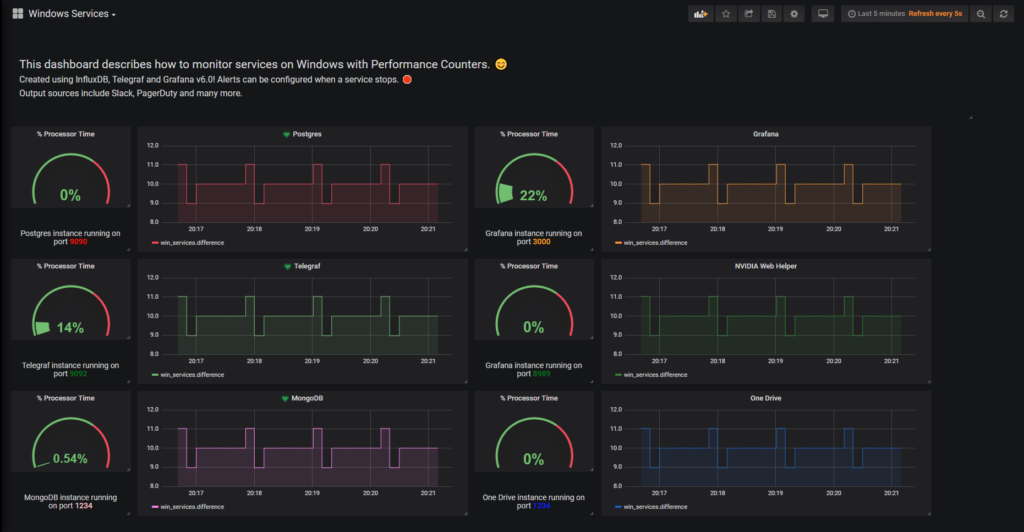
In Grafana, create a new dashboard by clicking on the plus icon on the left menu.
We chose the ‘Elapsed Time’ metric in order to measure if services are up or down. However, we have to perform transformations on our data as the Elapsed Time function is theorically a never-ending growing function.
As I already did it in my article on systemd services, I will give you the widget and the query for you to reproduce this dashboard.
a – Building The Performance Gauge
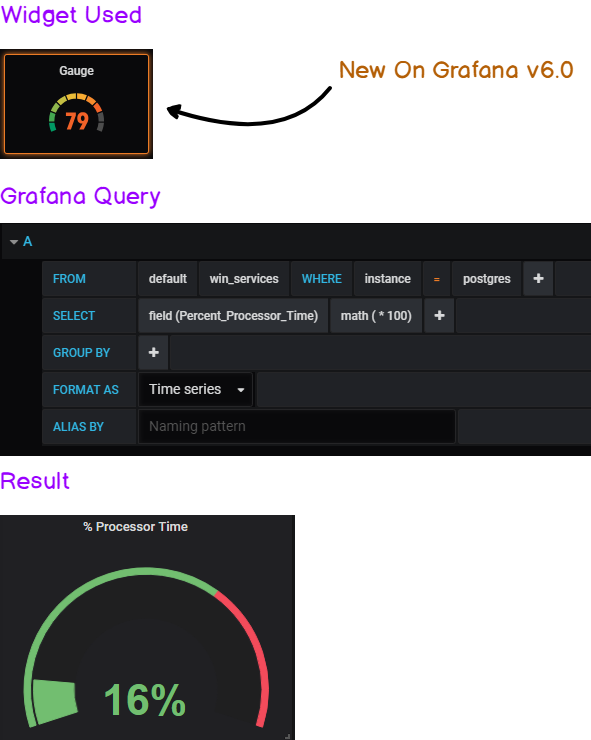
If you want to exact same output for the gauge, head over to the Visualization Panel : in the ‘Value Panel’, show the ‘Last’ value and select a ‘percent’ unit.
b – Building The ‘Availability’ Graph
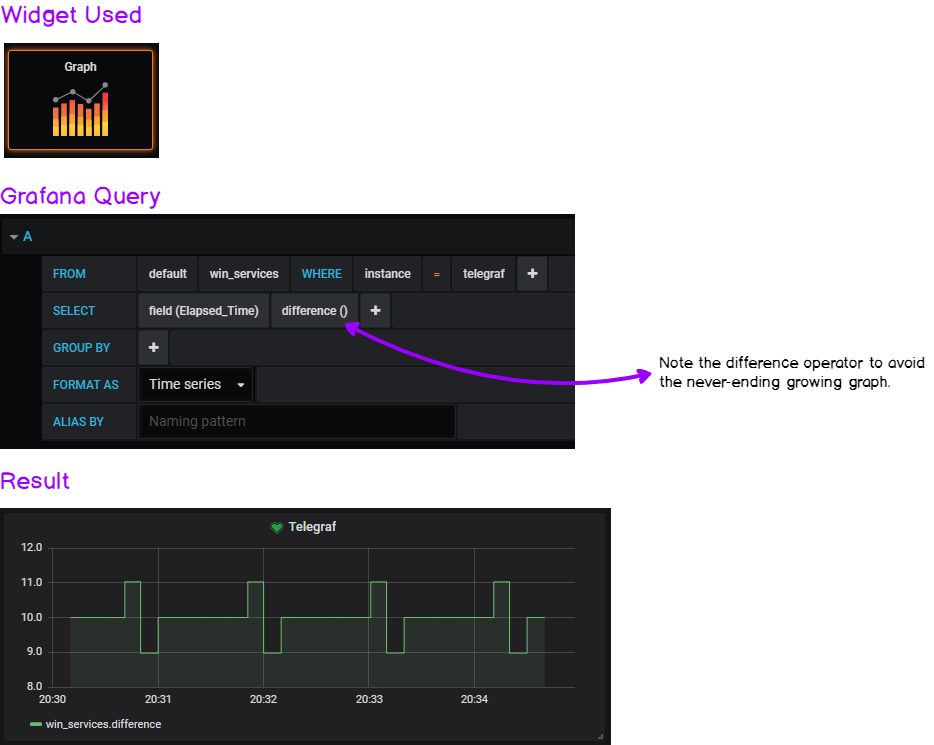
The key here is the difference operator. It gives the graph a ‘heartbeat’ look that avoids having a growing graph that rescales permanently.
If you want to have the exact same output, head over to the ‘Visualization’ panel and click on the ‘Staircase’ option.
The other boxes of this dashboard are just plain text panels with some CSS color, nothing special here!
You can of course tweak the examples to monitor the services you are interested in and/or modify the query to take an operator that you find more suitable to your needs.
Now that our visualization is ready, it is time to warn our DevOps team everytime a service fails.
Head over to the next section!
VI – Alerting the DevOps team on service failure
Visualizating service failure is great but you don’t want to be staring at Grafana every second and wait for a service failure.
Ideally, you would want to be notified via Slack for example in order to take immediate action over the failure.
This is exactly what we are going to configure on Grafana : slack alerts!
Let’s head to it.
In Grafana, you’ll be able to create some alerts only for the graph panel. Two steps, and we are done!
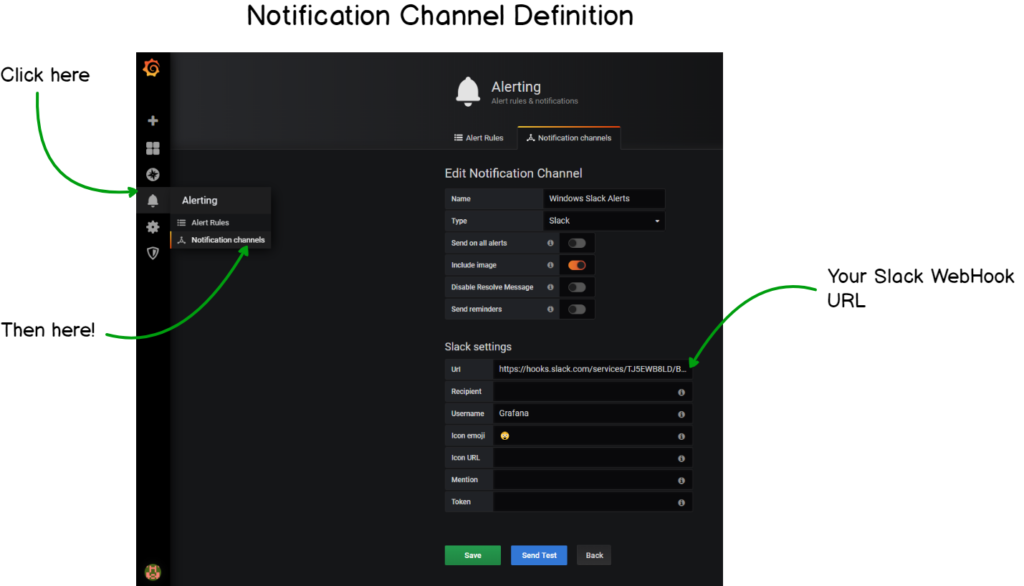
a – Creating A Notification Channel
Before creating the actual alert, we have to create a notification channel. In the left menu, head over to the little bell icon, and click on ‘Notification Channels’.
When you’re there, you are presented with a couple of fields that you have to fill. As an example, I’ll give you my own configuration.
b – Creating The Alert
Now that our notification channel is created, it is time to build our final alert on the graph panel. Head over to your dashboard, edit one of the graph panels and click on the little bell similar to the one on the left menu.
Again, I’ll provide a comprehensive screenshot on how I built my alerts.
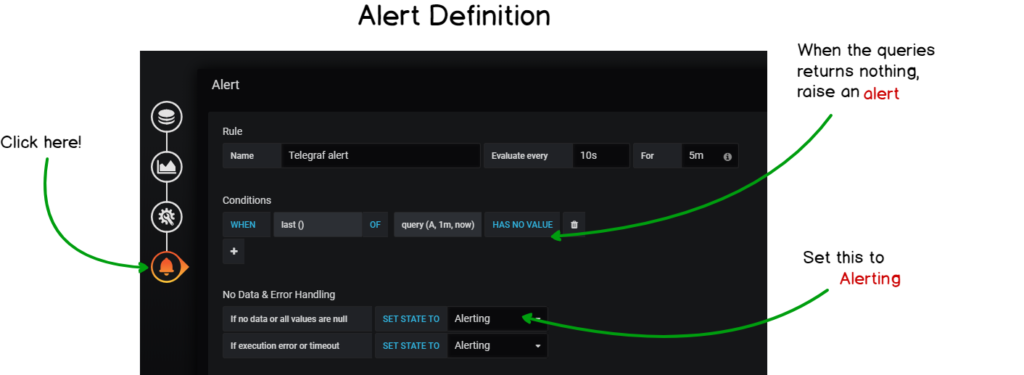
This alert states that it will evaluate the last value provided by the query that you defined earlier for the last minute. If it has no value, then an alert will be raised. The alert evaluation is done every 10 seconds.
You can reduce the ‘For’ parameter too to 10s for your alert to be more reactive.
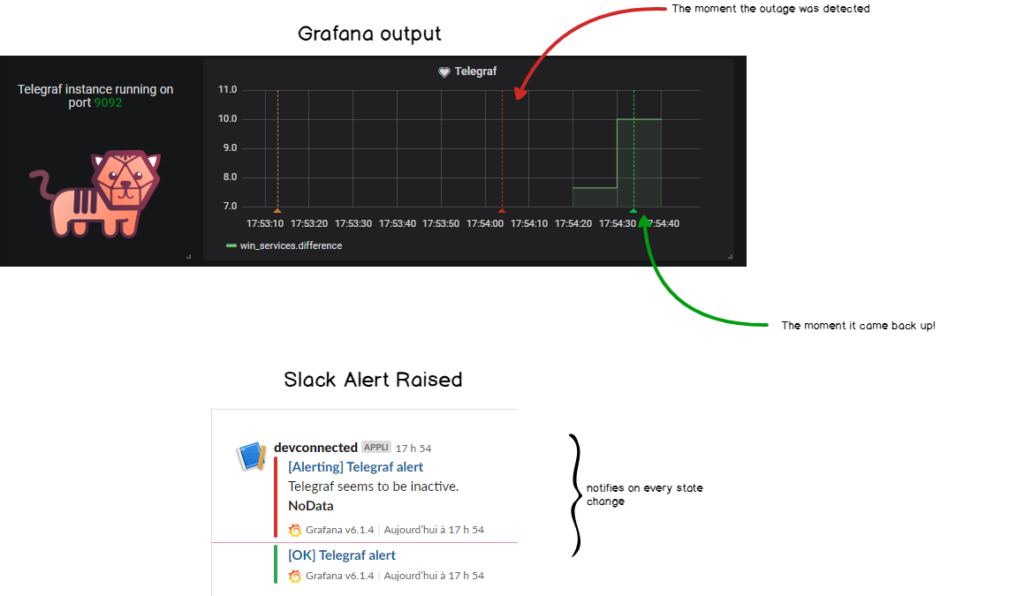
c – Emulating A Service Shutdown
Let’s pretend for a second that your Telegraf service is shutting down for no reason (it never happens in real-life, of course! 😉)
net stop telegrafHere’s the graphical result in Grafana, along with the alert raised in Slack!
Done! We finally got what the reward of this hard work. Congratulations!
X – Conclusion
With this tutorial, we learned many things : first, that Windows has an entire built-in API that we can leverage to our needs.
We saw how modern tools such as Telegraf, InfluxDB and Grafana can be used in order to setup a quick and efficient way to monitor applications.
In this tutorial, we took the concrete example of Windows services, but it can be applied to pretty much every performance counters that Windows exposes to its users.
IIS Monitoring, ASP.NET applications, Web Services, everything can be monitored with the Performance Counters and as a consequence implemented in Telegraf.
Knowing everything that you can now do, what metrics will you monitor on your system?
What value do you think it can bring to your company?
Leave a comment on this blog post and share your views on this project.
If you want to read more on the subject, make sure to read excellent posts written on InfluxData’s blog here. They all contain valuable information for the DevOps industry.
Until then, have fun, as always.
2 comments
[…] In 2019 4 Best Time Series Databases To Watch in… 4 Best Dashboard Monitoring Tools In 2019 Monitoring Windows Services with Grafana, InfluxDB & Telegraf 6 Tips To A Successful Code Review A Practical Introduction to Integration Patterns 5 Proven […]
[…] If you are on a Windows computer, you can learn how to monitor your windows services with this tutorial. […]