
InfluxDB is definitely a fast-growing technology. The time series database, developed by InfluxData, is seeing its popularity grow more and more over the past few months. It has become one of the references for developers and engineers willing to bring live-monitoring into their own infrastructure.
But what exactly is InfluxDB?
Why do you need it?
What value can you create by incorporating InfluxDB into your own environment?
This article is the starting point for every developer, engineer and IT professional that wants to learn InfluxDB, its concepts, use-cases and real-world applications.
The goal is to make you proficient with InfluxDB in under one week. We have segmented the InfluxDB learning paths into different modules, each one of them bringing a new level of understanding of time-series databases.
First, you will get an overall presentation of time-series databases, what they are, and how they differ from traditional relational databases.
Afterwards, you will be presented with an in-depth explanation of the concepts that define InfluxDB. Unfamiliar with measurements, tags or fields? Everything is explained.
Finally, you will see the use-cases of InfluxDB and how it can be used in a variety of industries. You will see real-world examples that you can emulate to bring value to your company or project.
Module 1 – What are Time-Series Databases?
Time Series Databases, as their name state, are database systems specifically designed to handle time-related data.
All your life, you have dealt with relational databases like MySQL, or SQL Server. You may also have dealt with NoSQL databases like MongoDB or DynamoDB.
Those systems are based on the fact that you have tables. Those tables contain columns and rows, each one of them defining an entry in your table. Often, those tables are specifically designed for a purpose : one may be designed to store users, another one for photos and finally for videos. Such systems are efficient, scalable and used by plenty of giant companies having million of requests on their servers.
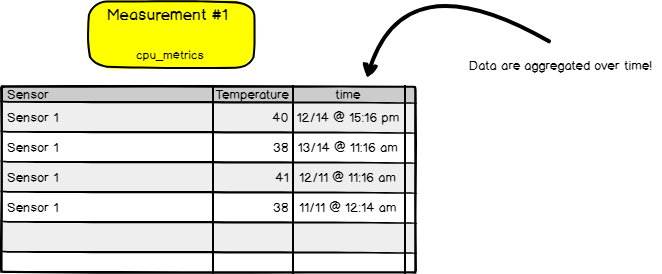
Time series databases work differently. Data are still stored in ‘collections’ but those collections share a common denominator : they are aggregated over time.
Essentially, it means that for every point that you are able to store, you have a timestamp associated with it.

But.. couldn’t we use a relational database and simply have a column named ‘time’? Oracle for example includes a TIMESTAMP data type that we could use for that purpose.
You could, but that would be inefficient.
a – Why do we need time series databases?
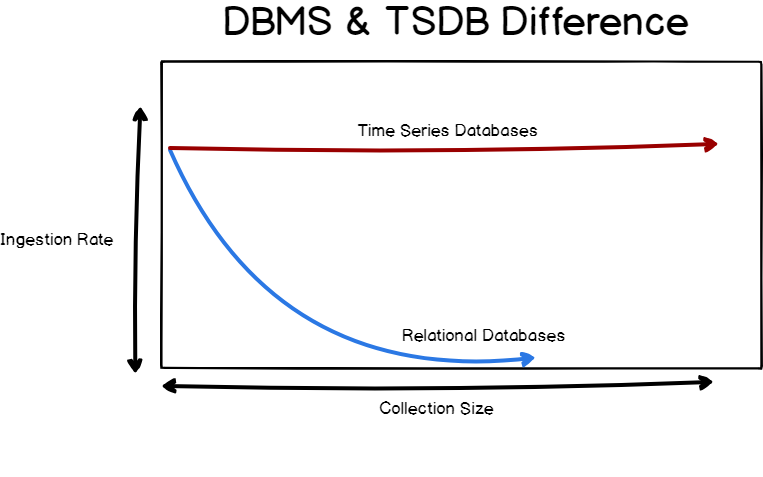
Three words : fast ingestion rate.
Time series databases systems are built around the predicate that they need to ingest data in a fast and efficient way.
Indeed, relational databases do have a fast ingestion rate for most of them, from 20k to 100k rows per second. However, the ingestion is not constant over time. Relational databases have one key aspect that make them slow when data tend to grow : indexes.
When you add new entries to your relational database, and if your table contains indexes, your database management system will repeatedly re-index your data for it to be accessed in a fast and efficient way. As a consequence, the performance of your DBMS tend to decrease over time. The load is also increasing over time, resulting in having difficulties to read your data.
Time series database are optimized for a fast ingestion rate. It means that such index systems are optimized to index data that are aggregated over time : as a consequence, the ingestion rate does not decrease over time and stays quite stable, around 50k to 100k lines per second on a single node.
https://blog.timescale.com/timescaledb-vs-6a696248104e/
b – Specific concepts about time series databases
On top of the fast ingestion rate, time series databases introduce concepts that are very specific to those technologies.
One of them is data retention. In a traditional relational database, data are stored permanently until your decide to drop them yourself. Given the use-cases of time series databases, you may want not to keep your data for too long : either because it is too expensive to do so, or because you are not that interested in old data.
Systems like InfluxDB can take care of dropping data after a certain time, with a concept called retention policy (explained in details in part two). You can also decide to run continuous queries on live data in order to perform certain operations.
You could find equivalent operations in a relational database, for example ‘jobs’ in SQL that can run on a given schedule.
c – A Whole Different Ecosystem
Time series databases are very different when it comes to the ecosystem that orbits around them. In general, relational databases are surrounded by applications : web applications, softwares that connect to it to retrieve information or add new entries.
Often, a database is associated with one system. Clients connect to a website, that contacts a database in order to retrieve information. TSDB are built for client plurality : you do not have a simple server accessing the database, but a bunch of different sensors (for example) inserting their data at the same time.
As a consequence, tools were designed in order to have efficient ways to produce data or to consume it.
Data consumption
Data consumption is often done via monitoring tools such as Grafana or Chronograf. Those solutions have built-in solutions to visualize data and even make custom alerts with it.
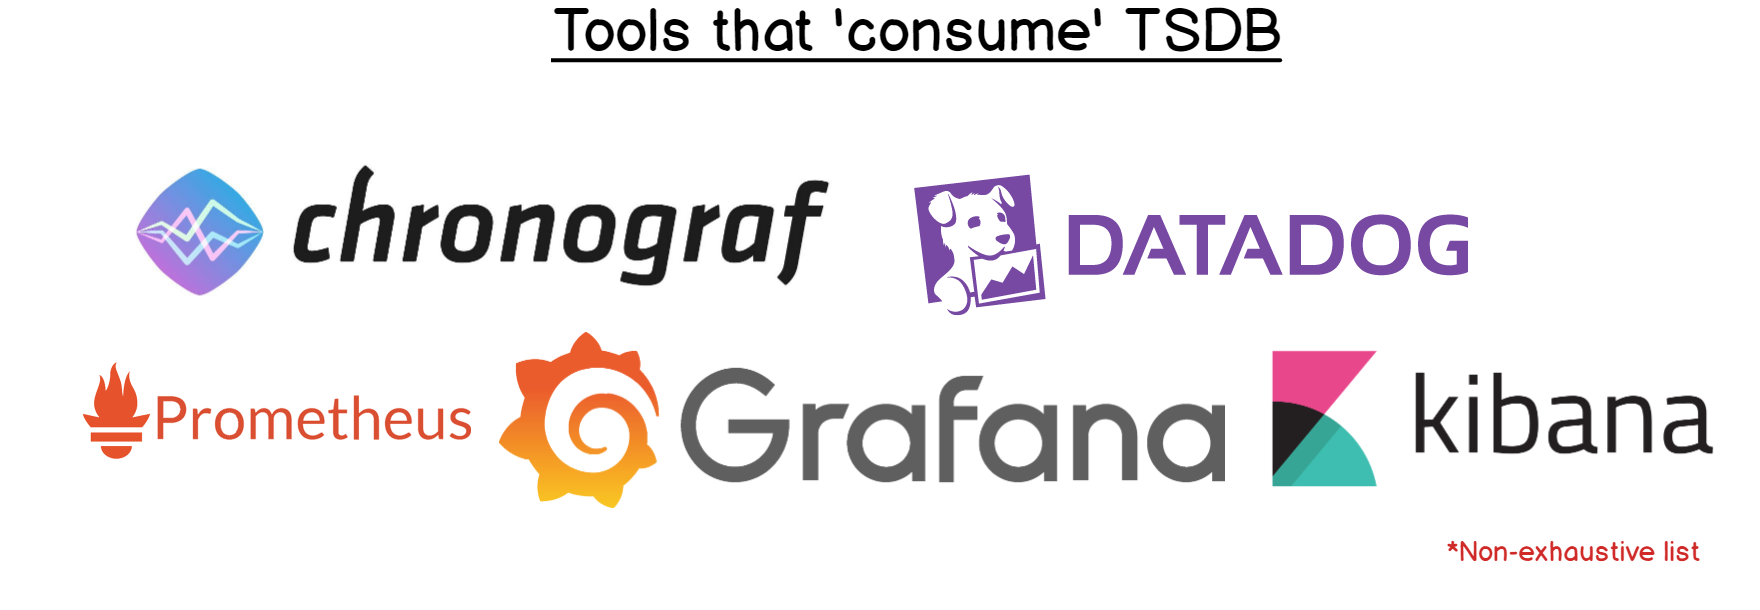
Those tools are often used to create live dashboards that may be graphs, bar charts, gauges or live world maps.
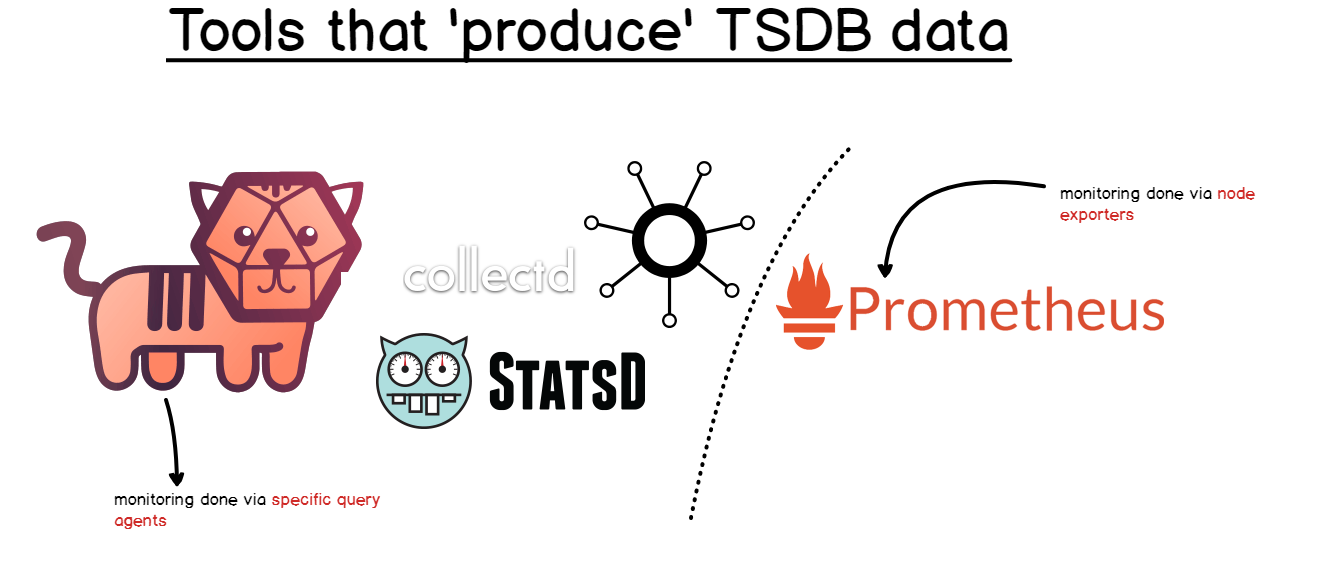
Data Production
Data production is done by agents that are responsible for targeting special elements in your infrastructure and extract metrics from them. Such agents are called “monitoring agents“. You can easily configure them to query your tools on a given time span. Examples are Telegraf (which is an official monitoring agent), CollectD or StatsD
Now that you have a better understanding of what time series databases are and how they differ from relational databases, it is time to dive into the specific concepts of InfluxDB.
Module 2 – InfluxDB Concepts Explained
In this section, we are going to explain the key concepts behind InfluxDB and the key query associated with it. InfluxDB embeds its own query language and I think that this point deserves a small explanation.
a – InfluxDB Query Language
Before starting, it is important for you to know which version of InfluxDB you are currently using. As of April 2019, InfluxDB comes in two versions : v1.7+ and v2.0.
v2.0 is currently in alpha version and puts the Flux language as a centric element of the platform. v1.7 is equipped with InfluxQL language (and Flux if you activate it).
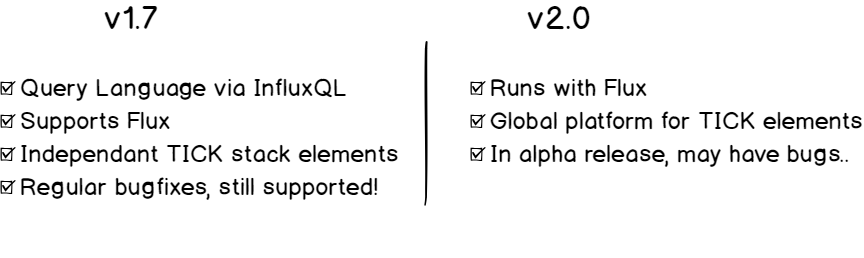
Right now, I do recommend to keep on using InfluxQL as Flux is not completely established in the platform.
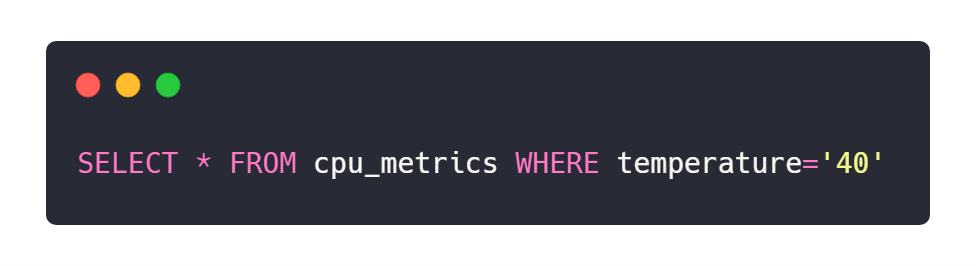
InfluxQL is a query language that is very similar to SQL and that allows any user to query its data and filter it. Here’s an example of an InfluxQL query :
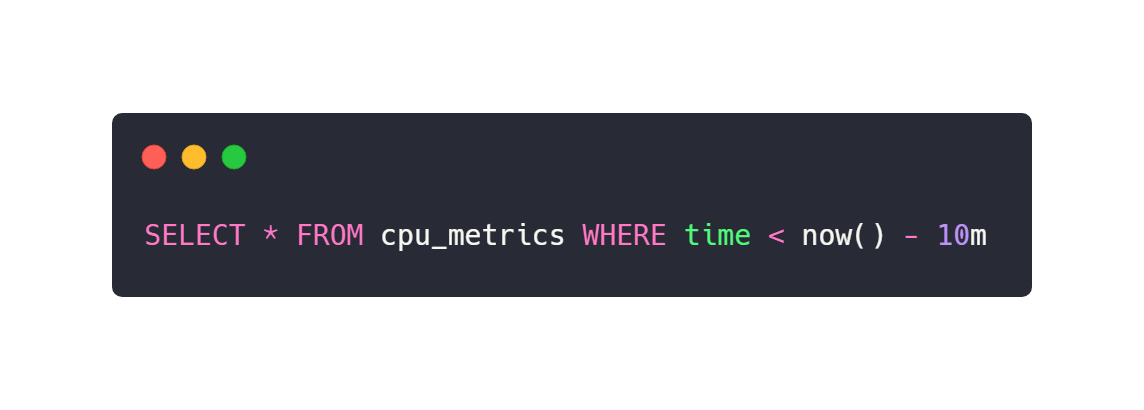
In the following sections, we are going to explore InfluxDB key concepts, provided with the associated IQL (short for InfluxQL) queries.
b – InfluxDB Key Concepts Explained
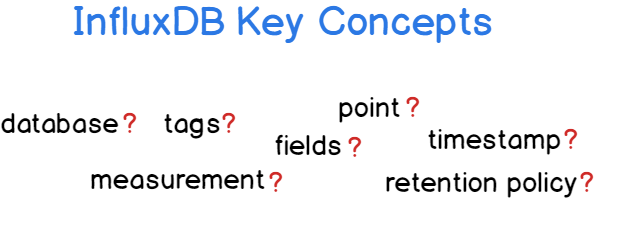
In this section, we will go through the list of essential terms to know to deal with InfluxDB in 2019.
Database
A database is a fairly simple concept to understand on its own because you are used to use this term with relational databases. In a SQL environment, a database would host a collection of tables, and even schemas and would represent one instance on its own.
In InfluxDB, a database host a collection of measurements. However, a single InfluxDB instance can host multiple databases. This is where it differs from traditional database systems. This logic is detailed in the graph below :
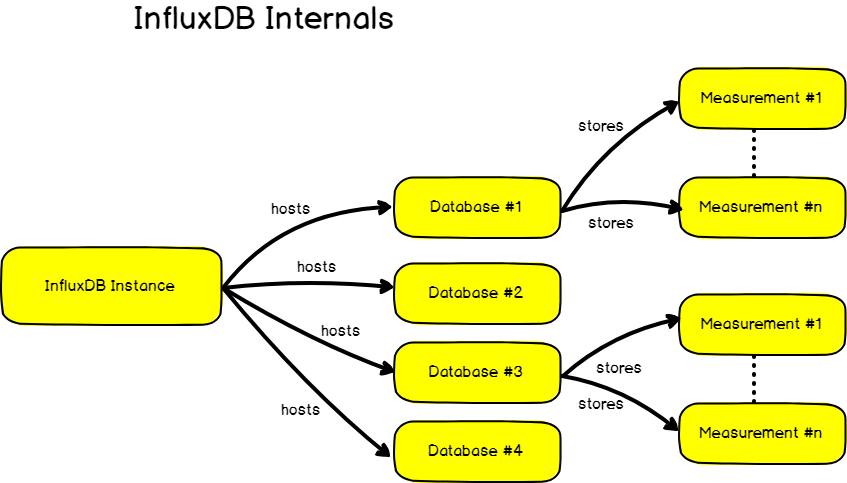
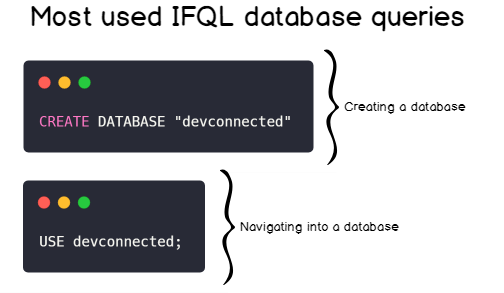
The most common ways to interact with databases are either creating a database or by navigating into a database in order to see collections (you have to be “in a database” in order to query collections, otherwise it won’t work).
Measurement
As shown in the graph above, a database stores multiple measurements. You could think of a measurement as a SQL table. It stores data, and even meta data, over time. Data that are meant to coexist together should be stored in the same measurement.
In a SQL world, data are stored in columns, but in InfluxDB we have two other terms : tags & fields.
Tags & Fields
Warning! This is a very important chapter as it explains the subtle difference between tags & fields.
When I first started with InfluxDB, I had a hard time grasping exactly why are tags & fields different. For me, they represented ‘columns’ where you could store exactly the same data.
When defining a new ‘column’ in InfluxDB, you have the choice to either declare it as a tag or as a value and it makes a very big difference.
In fact, the biggest difference between the two is that tags are indexed and values are not. Tags can be seen as metadata defining our data in the measurement. They are hints giving additional information about data, but not data itself.
Fields, on the other side, is literally data. In our past example, the temperature ‘column’ would be a field.
Back to our cpu_metrics example, let’s say that we wanted to add a column named ‘location’ as its name states, defines where the sensor is.
Should we add it as a tag or a field?
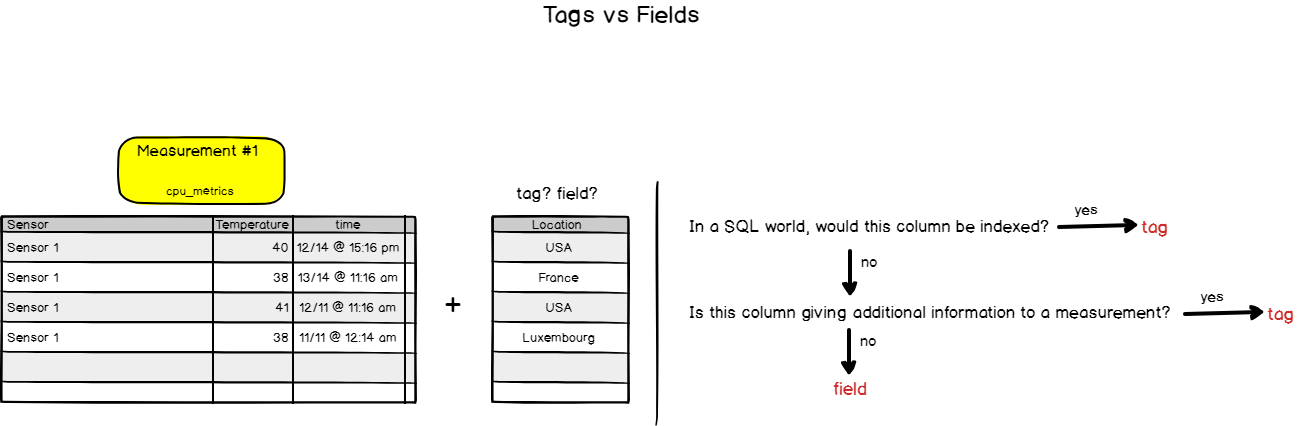
In our case, it would be added as a.. tag! We definitely want the location ‘column’ to be indexed and taken into account when performing a query over the location.
In general, I would advise to keep your measurements relatively small when it comes to the number of fields. More and more fields often rhymes with lower performance. You could create other measurements to store another field and index it properly.
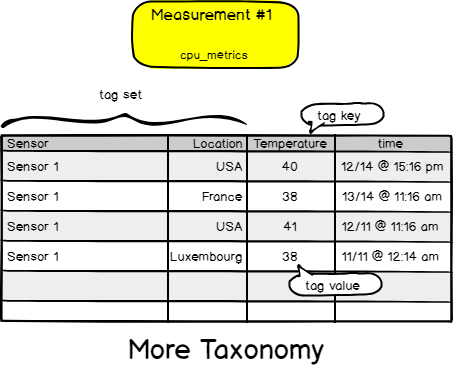
Now that we’ve added the location tag to our measurement, let’s go a bit deeper into the taxonomy.
A set of tags is called a “tag-set”. The ‘column name’ of a tag is called a “tag key”. Values of a tag are called “tag values”. The same taxonomy repeats for fields. Back to our drawings.
Timestamp
Probably the simplest keyword to define. A timestamp in InfluxDB is a date and a time defined in RFC3339 format. When using InfluxDB, it is very common to define your time column as a timestamp in Unix time expressed in nano seconds.
Tip : you can choose a nanosecond format for the time column and reduce the precision later by adding trailing zeros to your time value for it to fit the nanosecond format.
Retention policy
This feature of InfluxDB is for me one of the best features there is.
A retention policy defines how long you are going to keep your data. Retention policies are defined per database and of course you can have multiple of them. By default, the retention policy is ‘autogen‘ and will basically keep your data forever. In general, databases have multiple retention policies that are used for different purposes.
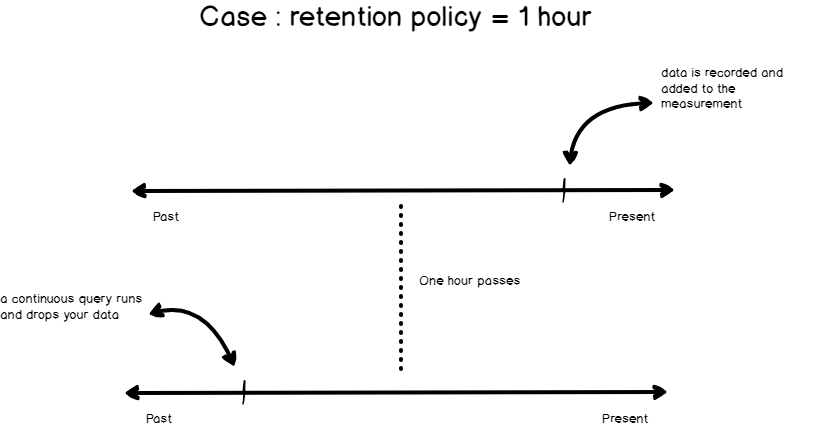
What are the typical use-cases of retention policies?
Let’s pretend that you are using InfluxDB for live monitoring of an entire infrastructure.
You want to be able to detect when a server goes off for example. In this case, you are interested in data coming from that server in the present or short moments before. You are not interested in keeping the data for several months, as a consequence you want to define a small retention policy : one or two hours for example.
Now if you are using InfluxDB for IoT, capturing data coming from a water tank for example. Later, you want to be able to share your data with the data science team for them to analyze it. In this case, you might want to keep data for a longer time : five years for example.
Point
Finally, an easy one to end this chapter about InfluxDB terms. A point is simply a set of fields that has the same timestamp. In a SQL world, it would be seen as a row or as a unique entry in a table. Nothing special here.
Congratulations on making it so far! In the next chapter, we are going to see the different use-cases of InfluxDB and how it can be used to take your company to the next level.
Module 3 – InfluxDB Use-Cases
DevOps Monitoring
DevOps Monitoring is a very big subject nowadays. More and more teams are investing in building fast and reliable architectures that revolve around monitoring. From services to clusters of servers, it is very common for engineers to build a monitoring stack that provides smart alerts.
If you are interested in learning more about DevOps Monitoring, I wrote a couple of guides on the subject, you might find them relevant to your needs.
https://devconnected.com/monitoring-systemd-services-in-realtime-with-chronograf
From the tools defined in section 1, you could build your own monitoring infrastructure and bring direct value to your company or start-up.
IoT World
The IoT is probably the next big revolution that is coming in the next few years. By 2020, it is estimated that over 30 billion devices will be considered IoT devices. Whether you are monitoring a single device or a giant network of IoT devices, you want to have accurate and instant metrics for you to take the best decisions regarding the goal you are trying to achieve.
Real companies are already working with InfluxDB for IoT. One example would be WorldSensing, a company that aims at expanding smart cities via individual concepts such as smart parking or traffic monitoring system. Their website is available here : https://www.worldsensing.com/
Industrial & Smart Plants
Plants are becoming more and more connected. Tasks are more automated than ever : as a consequence it brings an obvious need to be able to monitor every piece of the production chain to ensure a maximal throughput. But even when machines are not doing all the work and humans are involved, time-series monitoring a unique opportunity to bring relevant metrics to managers.
Besides reinforcing productivity, they can contribute to building safer workplaces as they are able to detect issues quicker. Value for managers as well as for workers.
Your Own Imagination!
The examples detailed above are just examples and your imagination is the only limit to the applications that you can find for time series databases. I have shown it via some articles that I wrote, but time-series can be even used in cybersecurity!
If you have cool applications of InfluxDB or time-series database, post them as comment below, it is interesting to see what idea people can come up with.
Module X – Going Further
In this article, you learned many different concepts : what are time-series databases and how they are used in the real world. We have gone through a complete list of all the technical terms behind InfluxDB, and I am confident now to say that you are to go on your own adventure.
My advice to you right now would be to build something on your own. Install it, play with it, and start bringing value to your company or start-up today. Create a dashboard, play with queries, setup some alerts : there are many things that you will have to do in order to complete your InfluxDB journey.
If you need some inspiration to go further, you can check the other articles that we wrote on the subject : they provide clear step by step guides on how to setup everything.
Something you want me to write about in the next articles?
Leave a comment below with your idea. 💡
Until next time, have fun, as always.
19 comments
I absolutely love your website.. Pleasant colors & theme.
Did you build this amazing site yourself? Please reply back as I’m wanting to create my
very own blog and want to find out where
you got this from or what the theme is called.
Thanks! I just couldn’t go away your web site before suggesting that I really loved
the usual info an individual provide in your visitors? Is going to be back continuously in order to check out
new posts I have been browsing online more than 2 hours today,
yet I never found any interesting article like yours. It’s pretty
worth enough for me. Personally, if all webmasters
and bloggers made good content as you did, the internet will be much more useful than ever
before.
Just desire to say your article is as amazing. The clearness in your
put up is simply nice and that i could suppose you’re an expert on this subject.
Fine along with your permission let me to snatch
your feed to keep updated with imminent post. Thank you one million and please keep up
the gratifying work.
Thanks for some other fantastic article.
The place else could anybody get that type of info in such an ideal method of writing?
I have a presentation next week, and I am at the search for such
information.
[…] The Definitive Guide To InfluxDB In 2019 […]
[…] The Definitive Guide To InfluxDB In 2019 […]
I just want to say I am very new to blogs and truly savored you’re web site. More than likely I’m likely to bookmark your website . You amazingly come with superb articles and reviews. Regards for sharing your webpage.
[…] The Definitive Guide To InfluxDB In 2019 […]
[…] The Definitive Guide To InfluxDB In 2019 […]
Thank you for this very well written article. Good job!
[…] InfluxDays London 2019 Recap Monitoring Linux Processes using Prometheus and Grafana The Definitive Guide To InfluxDB In 2019 4 Best Time Series Databases To Watch in… How To Install Git On Debian 10 Buster How To […]
Nice blog.
But how can I create a new Measurement?
thank you bro
[…] If you are unfamiliar with basics of InfluxDB and what IFQL is, check my ultimate InfluxDB guide for beginners. It contains good explanations regarding everything that you need to know: https://devconnected.com/the-definitive-guide-to-influxdb-in-2019/ […]
Hello! This website is great. I particularly love how you’re making proper efficient use of all the horizontal space.
Regarding Influxdb, great content!
If I may suggest a follow-up, I would suggest a hand-on walkthrough of influxdb: starting up two linked containers with influxdb and chronograf, loading some example data, performing some queries via chronograf and then visualizing the results, always in chronograf.
Keep rocking!
Thank you for the comment, kind stranger!
[…] If you are unfamiliar with basics of InfluxDB and what IFQL is, check my ultimate InfluxDB guide for beginners. It contains good explanations regarding everything that you need to know: https://devconnected.com/the-definitive-guide-to-influxdb-in-2019/ […]
The “More Taxonomy” image…
it has little word balloons for “tag key” and “tag value”. Are they pointing at tag things or at field things?
And the “time” values look strange — 13/14 is neither MM/DD nor DD/MM. Am I missing something, or is this just “dummy data, pay no attention to the numbers”?
Thanks,
Excellent Article for newbies great opener, in simple words.
Thanks !
I think in the second picture to “Tags & Fields” there is a minor mistake: For the temperature it writes there “tag key” and “tag value” where I think it should actually mean “field key” and “field value”.