Every system administrator knows systemd. Developed by Lennart Poettering and freedesktop.org, systemd comes as a very handy initialization tool for administrating Linux services and handling dependencies. Most of the modern tools are shipped as systemd services and managed from there.
But what happens when one of the services fails? Most of the time, you discover it when the damage is already done.
Today, we are going to build a complete dashboard that monitors systemd services in realtime. It will provides us with active, inactive and failed services, and even raise alerts to Slack when one fails!
I — A Quick Word On D-Bus
Again, before jumping into architectural concerns and coding, let’s have a quick reminder about what is D-Bus and how it will help us achieving our goal. (if you’re a D-Bus expert, you can jump to section II).
D-Bus is an inter-process communication bus that, as its name underlines, allows multiple applications registered on it to communicate.
The applications using D-Bus are either servers or clients. A client connects to a D-Bus server and a server listens for incoming connections. Applications traditionally connect to a D-Bus server, they register to it and are given a well-known name to identify themselves.
From there, applications exchange messages and signals that may be captured by clients connected on the bus.
D-Bus purpose may be a bit hazy at first, but it comes as a very useful tool for your Linux system.
Applications such as the UPower service (responsible for monitoring your system power sources) could communicate with the thermald service (monitoring the overall temperature) to bring the power consumption down if some overheating problem were to be detected (without you even noticing it!)
So what’s the link between D-Bus and monitoring our systemd services?
Systemd is registered on D-Bus as the org.freedesktop.systemd1 service. Moreover, it sends some signals to the clients when the state of a systemd service changes over time.
This is what we are going to use for our whole system.
II — Capturing D-Bus signals
For this article, I am using a Xubuntu 18.04 machine with a standard Linux kernel. Our machine has to run the dbus-daemon and has to have the busctlutility installed.
One can check that this is the case by running :
(1) ps aux | grep dbus-daemon : results should enumerate at least two entries : one bus for the system and one bus for the session.
(2) busctl status : checks the bus status and returns the bus configuration.

a — Identifying useful D-Bus signals
As explained before, systemd service is registered on the bus and is sending signals when something related to systemd happens.
When a service starts, stops, or fails, systemd broadcasts signals on the bus to all available clients. As ton of messages are broadcasted by systemd when events occur, we are going to redirect the standard output to a file to analyze it.
sudo busctl monitor org.freedesktop.systemd1 > systemd.output will do the trick. Inspecting the file, we are presented with lots of messages, method calls, method returns and signals.
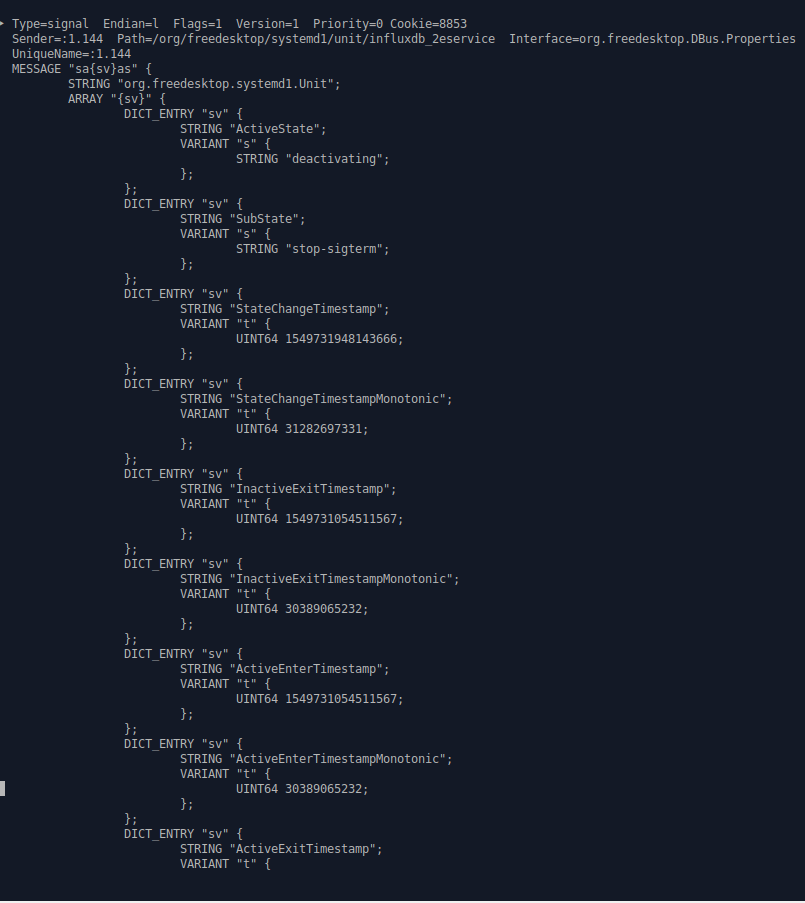
See the ‘ActiveState’ line with the ‘deactivating’ value? That’s my InfluxDB service deactivating for a moment. We can even capture the timestamprelated to the change!
The org.freedesktop.systemd service specifies 6 different states : active, reloading, inactive, failed, activating, deactivating. We are obviously particularly interested in the failed signal as it notifies a service failure on our system.
Now that we have a way to manually capture systemd signals on our system, let’s build our full automated system monitoring system.
Let the fun begin!
III — Architecture & Implementation
In order to monitor systemd services, we are going to use this architecture :
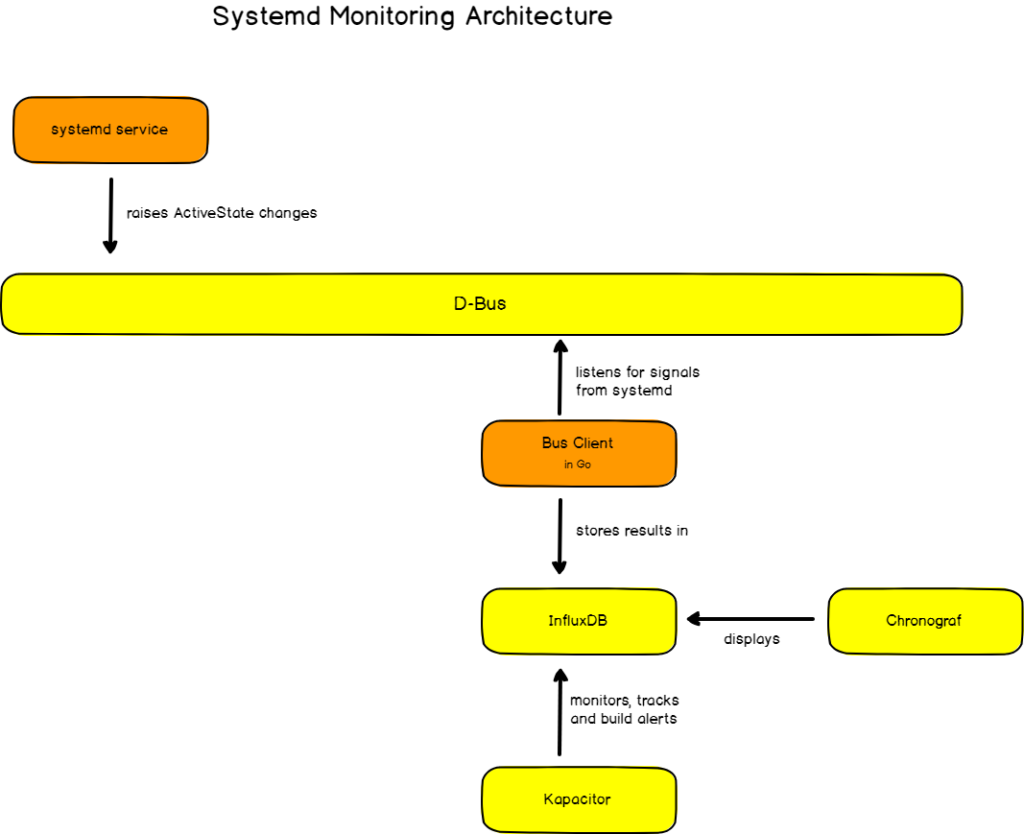
Our systemd monitoring final architecture
Our architecture is pretty straight-forward. First, we ensured that we have the dbus-daemon running on our machine.
From there, we are going to build a simple D-Bus client (in Go!) that will subscribe to signals originating from systemd. All incoming signals will be parsed and stored in InfluxDB.
Once points are stored in InfluxDB, we will create a Chronograf dashboardshowing statistics about our services and gauges reflecting their current state on our machine.
When a service fails, Kapacitor (a stream processing engine) will pick it up and will automatically send an alert to Slack for our system administration group.
Simple! Right?
a — Building A D-Bus client in Go
The first step in order to capture signals coming from systemd is to build a simple client that will :
- Connect to the bus.
- Subscribe to systemd signals.
- Parse and send points to InfluxDB.
Note : you may wondering why I chose Go to build my D-Bus client. Both dbusand InfluxDB client libraries are written in Go, making this language the perfect candidate to handle this little experiment.
The client code is quite lengthy for it to be full displayed on this article, but here’s the main function that does most of the work. Full code is available on my Github. ⭐
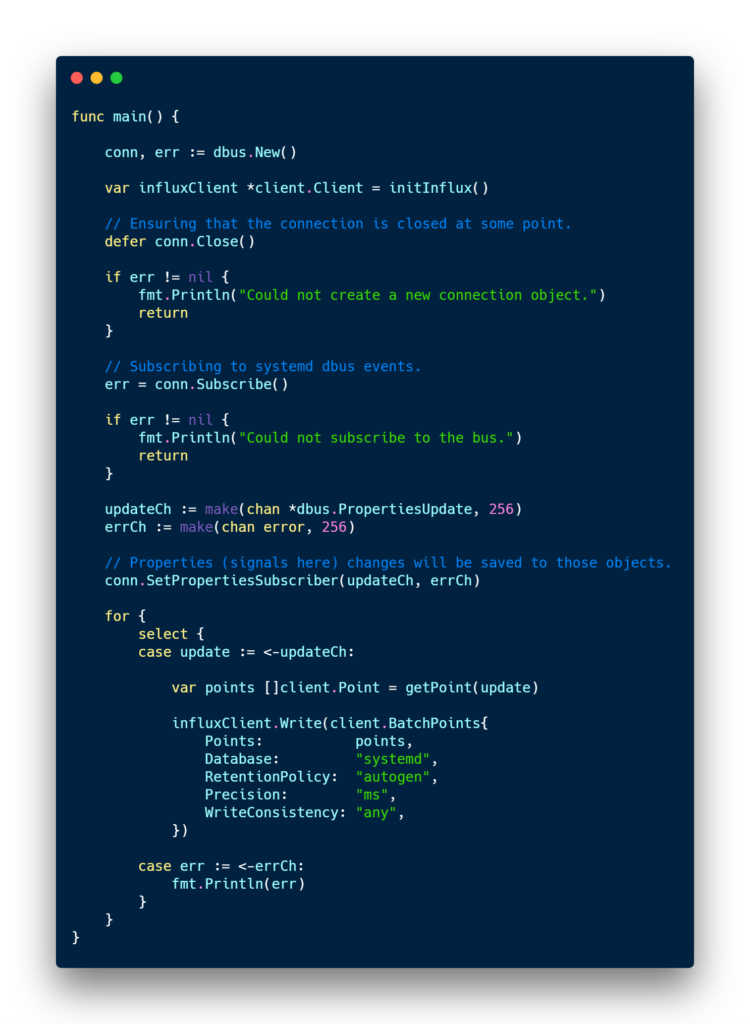
For every single systemd signal, a point is created in InfluxDB. I chose this implementation because I wanted to have a full history of all the changes occurring on my different services. It can be quite useful for investigating about some recurrent service failure over a period.
b — Implementation choices
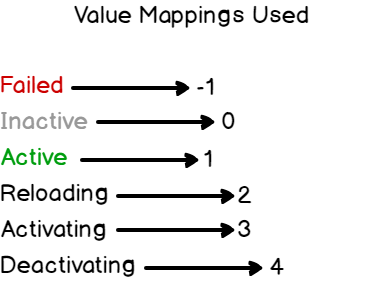
For my InfluxDB data structure, I chose to have my service name as a tag (for indexes purposes), and the state (failed, active, activating..) as the value.
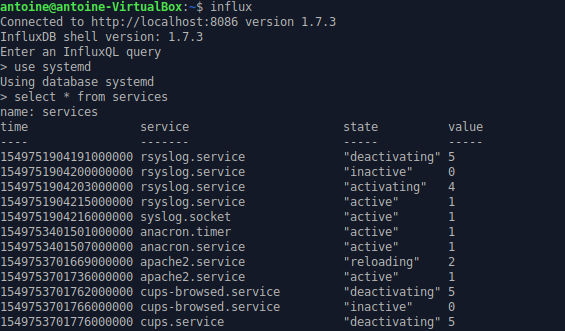
A simple mapping links a constant value to every single state. IQL aggregation functions work better when used with numeric values rather than text values.
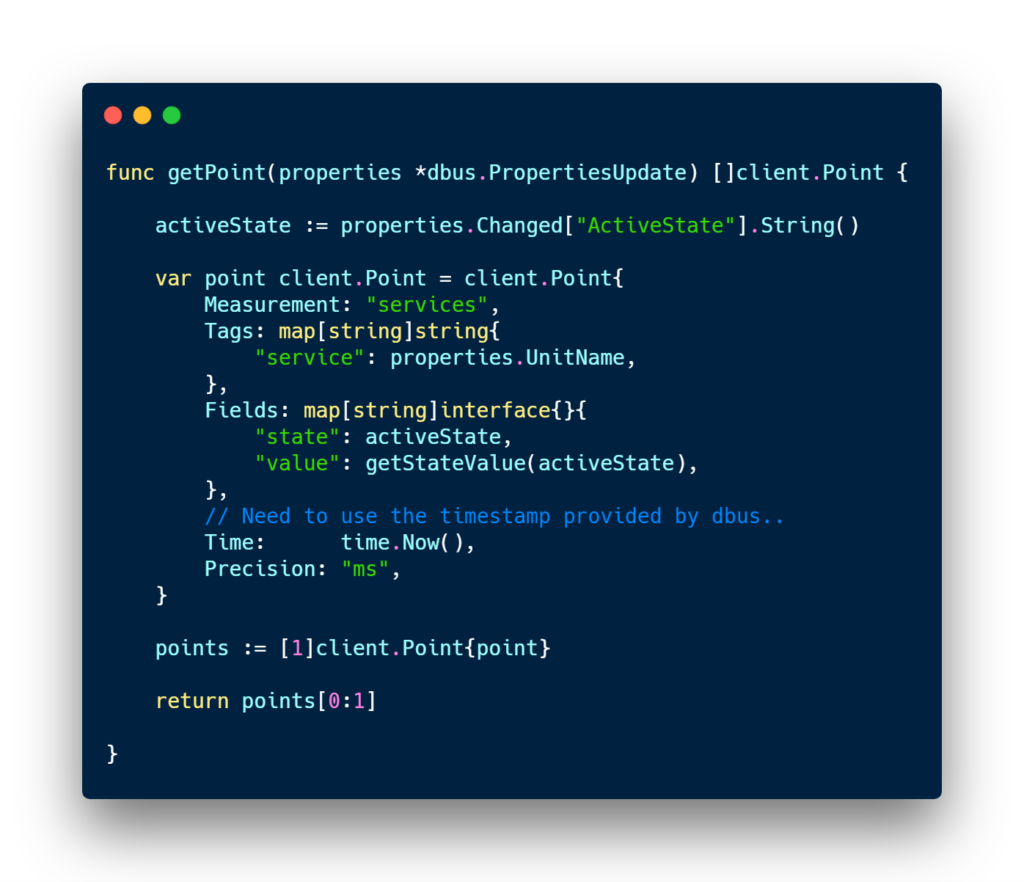
Note : in the snippet above, one can notice that I get many properties updates from systemd, but I extract the ‘ActiveState’ property that we saw in the first section.
Now that we have our simple Go client, let’s wrap it into a service, run it, and head over to Chronograf.
III — Building a cute dashboard for sysadmins
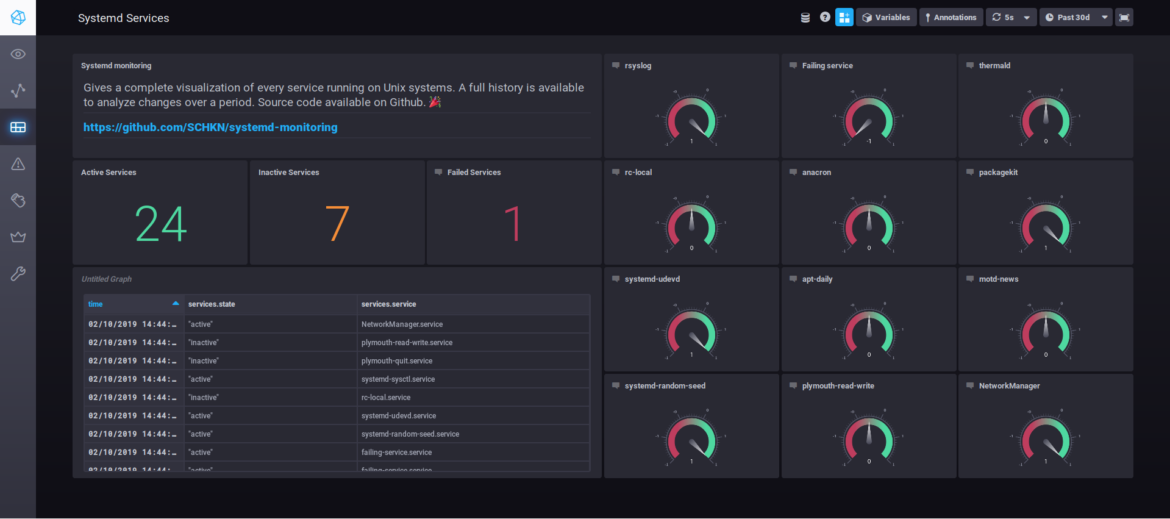
Now that we have our points in InfluxDB, this is where the fun begins. We will build a Chronograf dashboard that will show us some statistics related to our services and gauges for important services we want to monitor.
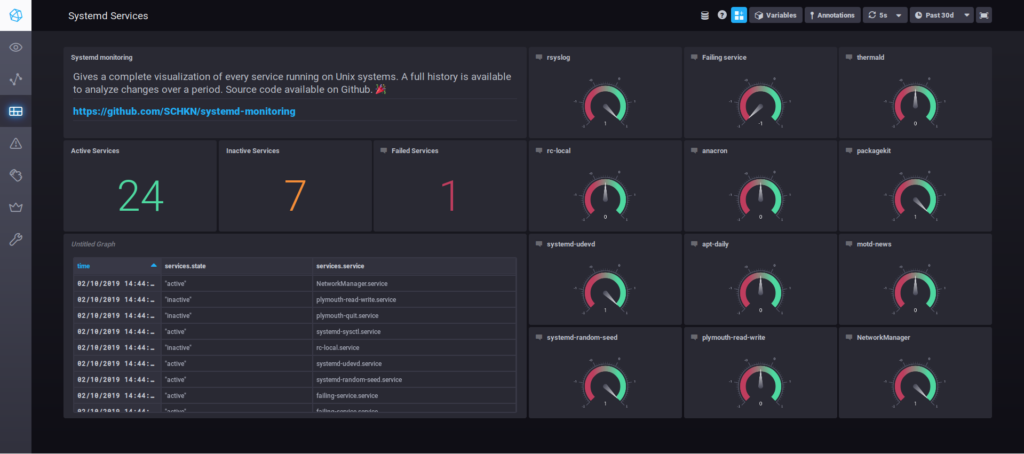
The final dashboard has three main parts :
- Count of active, inactive and failed services at a given time.
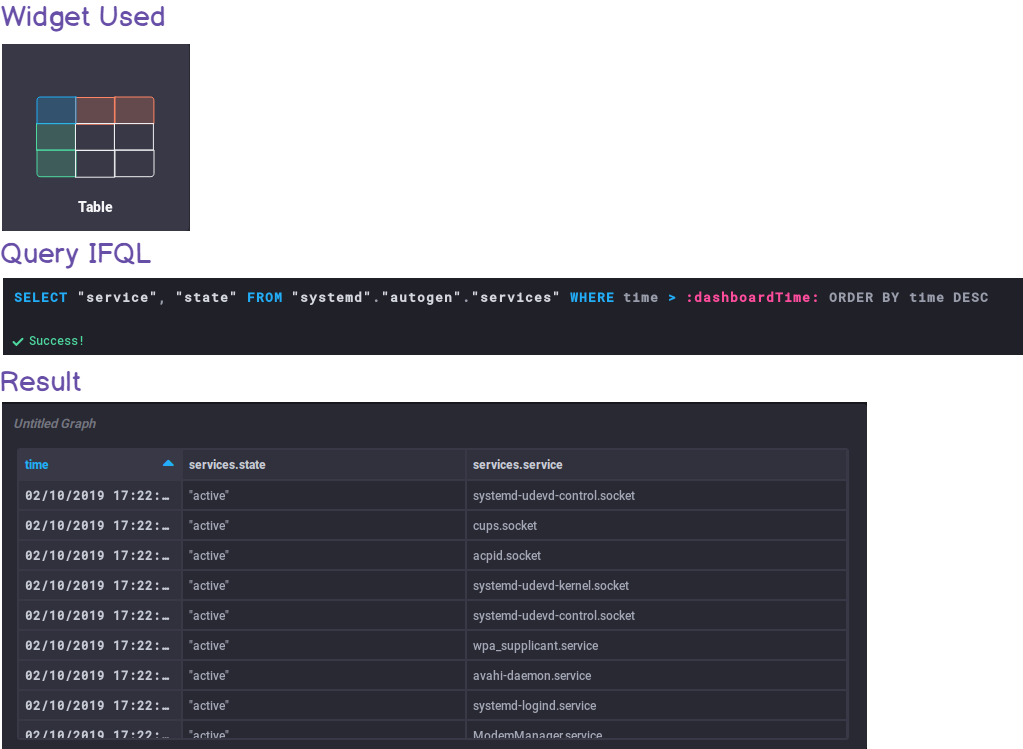
- Table showing a full history of state changes over time for every service.
- 12 gauges displaying 12 different systemd services we want to put the emphasis on.
Disclaimer : this part assumes that one has some preliminary knowledge of Chronograf ; how to set it up and link it to InfluxDB. Documentation is available here. Queries will be provided for each block of this dashboard.
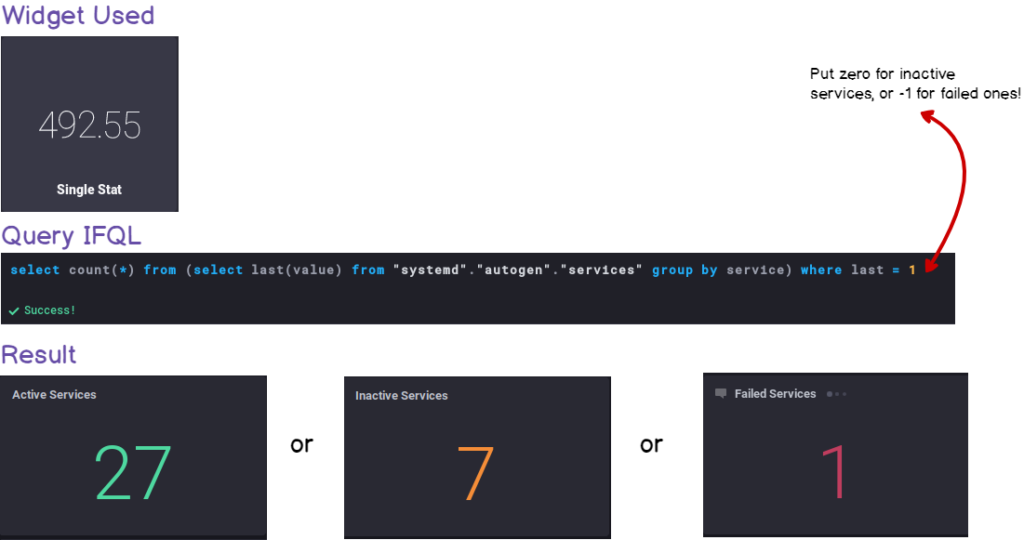
a — Counting active, inactive and failed services
Here’s the way to build the single-stat blocks :
b — Full table history of state changes
In the same fashion, here are the inputs used to build the history table :
c — Gorgeous gauges for specific services
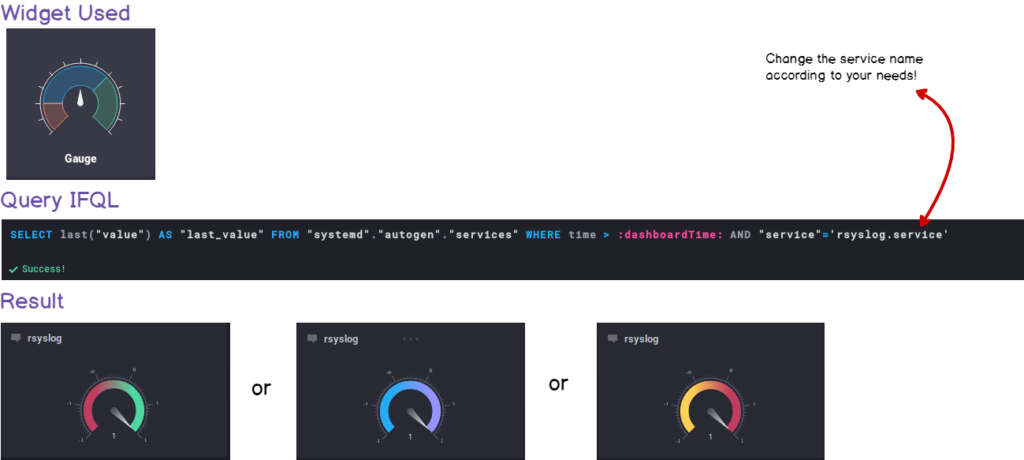
Of course, I encourage everyone to toy around with the widgets and to build your own dashboards, it doesn’t have to be the exact copycat of the dashboard present above.
Now that we have our dashboard, we have a very cool way to monitor in real-time our systemd services. Nice!
But what if we had realtime alerts on Slack when a running is failing? Wouldn’t the DevOps team love this feature?
Let’s head to it.
IV — Raising Alerts On Service Failure
For the last part, we are going to use Kapacitor, a stream processing enginethat will be responsible for raising and processing alerts when a service is failing.
Documentation for Kapacitor is available here.
Once Kapacitor is installed and running on your machine, let’s go back to Chronograf and head over to the alert panel.
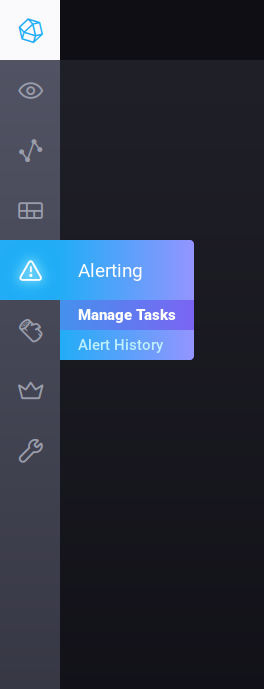
When clicking on Manage Tasks, you are presented with two sections : alert rules and tick scripts. Let’s create a new alert rule by clicking on the ‘Build Alert Rule’ button.

And here’s the full alert configuration used for this alert :
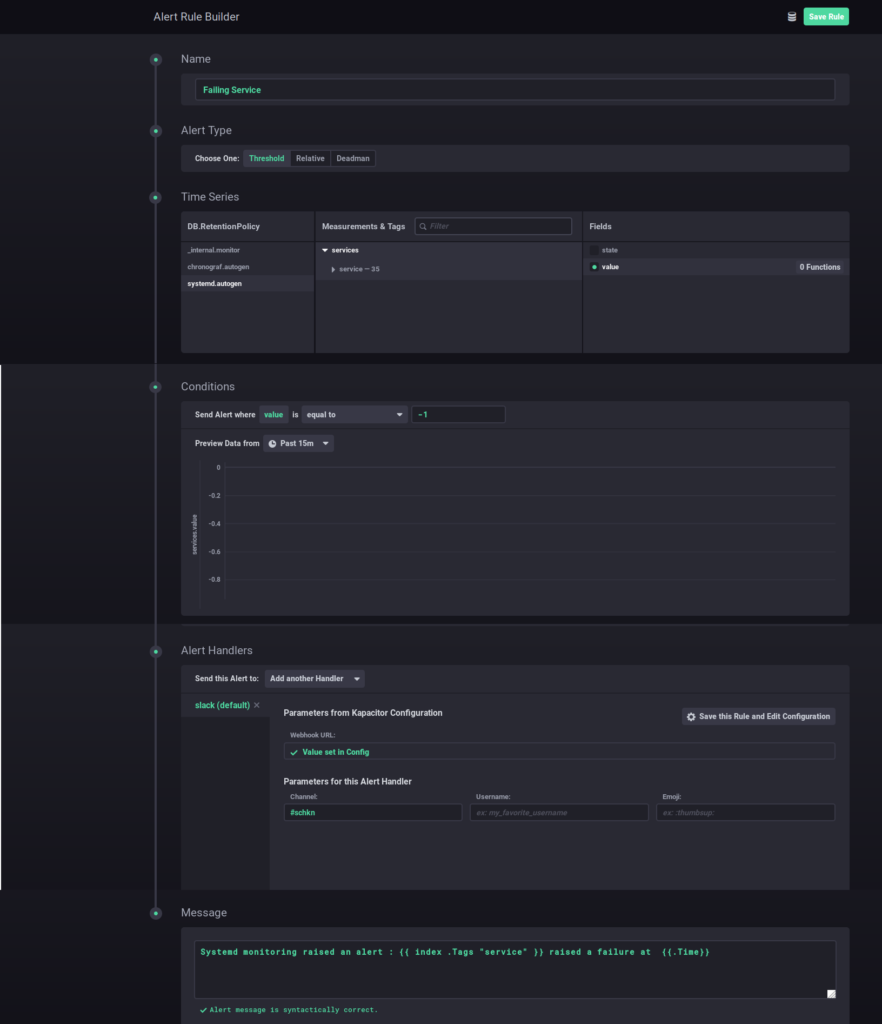
This alert is configured to send an alert to a Slack webhook when a service is failing (i.e the state value is equal to minus one) on a fifteen minutes time window. On the Slack side, the alerts has this format :

V — Conclusion
I learned many things building this little project. Having no prior experience with D-Bus, or with Golang whatsoever, this experiment taught me that getting out of your comfort zone (even in programming) is the way to go to build new skills.
The process of building such a dashboard can seem quite arduous, but once deployed, it provides real value to operational teams and system administrators in general.
If you like hand-crafting your own monitoring solutions, you can definitely take some inspiration from this tutorial. If you’re more into delegating to external tools, I would definitely recommend SignalFX or Telegraf. They are both robust and efficient solutions for your infrastructure.
SignalFX link is available here.
Telegraf documentation is available here!
I hope that you had some fun reading this little (well not so little) tutorial on how to build realtime systemd monitoring dashboards from scratch.
I had a ton of fun on my side building it and writing this article. If you have any question about this tutorial, or software engineering in general I will be happy to help.
Until next time.
Kindly,

8 comments
Great!
[…] Monitoring systemd services in realtime with Chronograf […]
[…] Monitoring systemd services in realtime with Chronograf […]
[…] Monitoring systemd services in realtime with Chronograf […]
[…] Finally, here’s a tutorial to learn how to monitor your systemd services in real time with InfluxDB and Chronograf. […]
[…] exporters as a background process is the best way to crash them. Plus, you can monitor your systemd services and be notified when one goes […]
[…] I already did it in my article on systemd services, I will give you the widget and the query for you to reproduce this […]
Great article, thanks:)