
Created in 2012 at SoundCloud, Prometheus is a time series database used in DevOps for real time monitoring.
Prometheus is part of an ecosystem that provides alerting, dashboarding as well as a whole set of tools to bind to your existing datasources.
On the other hand, Docker is a virtualization platform that provides a way to easily create, manage and run containers in a single node environment or a cluster.
Docker is very heavily used to ensure that deployment environments are consistent wherever you want them to be run.
If you are a system administrator, or a site reliability engineer, you are probably trying to set up reliable monitoring architectures.
One of the ways to achieve it is to set up Prometheus in a Docker container. This way, you are able to test it on your local system and to ensure that it will behave the same when deploying it on a remote server.
In today’s tutorial, we are going to install Prometheus with Docker as well as setting up a basic configuration for Prometheus.
In the container, we are also going to install the Node Exporter in order to gather metrics from your local Linux host.
Prerequisites
In order to install Prometheus on Docker, you will need to have sudo rights on your host.
If you are not sure about it, run the following command
$ sudo -v1. Installing Docker on Ubuntu
Before installing Prometheus on Docker, it is important that Docker is already correctly installed and configured on your instance.
If you need a complete Docker installation for Ubuntu, there is a guide on devconnected about it.
Before moving to the next section, make sure that you have the latest version of Docker running.
$ docker --version
Docker version 19.03.1, build 74b1e89
Now that your Docker is ready, let’s install the Prometheus container.
2. Installing Prometheus on Docker
The official Prometheus image for Docker is named : prom/prometheus.
The “prom” community organization is also editing Docker images for all the components of the Prometheus stack : alertmanager, node exporter, MySQL exporter or the Pushgateway.

The Prometheus Docker image is going to install the Prometheus server. It is the one responsible for aggregating and storing time series metrics.
The configuration files and the data directories are going to be stored on the local host filesystem.
As a consequence, those folders will be mapped into the Docker container to ensure data persistence. It is also easier to modify files on the local filesystem rather than in a container.
a – Prepare Prometheus for Docker
Similarly to the way we have installed Prometheus and Grafana on Linux, create a user for Prometheus on your system if not already existing.
$ sudo useradd -rs /bin/false prometheusIn your etc directory, create a new folder and a new configuration file for Prometheus.
$ sudo mkdir /etc/prometheus
$ cd /etc/prometheus/ && sudo touch prometheus.yml
Similarly, create a data folder for Prometheus.
$ sudo mkdir -p /data/prometheusMake sure that the permissions are correctly set for the configuration file and for the data folder.
$ sudo chown prometheus:prometheus /data/prometheus /etc/prometheus/*This way, only the Prometheus and root can modify this file. This provides greater security to our Prometheus setup.
b – Configure Prometheus for Docker
The way step consists in filling up the configuration file we just created. Head over to your configuration folder, and start editing the file.
$ vi /etc/prometheus/prometheus.ymlPaste the following configuration in your file.
# A scrape configuration scraping a Node Exporter and the Prometheus server
# itself.
scrape_configs:
  # Scrape Prometheus itself every 10 seconds.
  - job_name: 'prometheus'
    scrape_interval: 10s
    target_groups:
      - targets: ['localhost:9090']
For now, Prometheus is only going to monitor itself.
Later on, we are going to add the Node Exporter that will be responsible for gathering metrics from our local Linux system.
Now that Prometheus is configured for Docker, we are going to run the Prometheus container.
c – Running the Prometheus Docker container
We are going to use the image from the Prometheus image from the prom repository.
As a reminder, to start a Docker container, you have to use the docker container run command.
Make sure that nothing is running on the port 9090 already.
$ sudo netstat -tulpn | grep 9090As we configured our folders to be accessible by the Prometheus user, you will have to determine the ID for this user.
To find the Prometheus user ID, head over the passwd file and run
cat /etc/passwd | grep prometheus
prometheus:x:996:996:/home/prometheus:/bin/false
As you can see, the Prometheus user ID is 996. This is what we are going to use to create our Prometheus container.
Note : the user ID might be different on your instance. If it is the case, modify the –user parameter in the command below.
To start Prometheus on Docker, run the following command.
docker run -d -p 9090:9090 --user 996:996 \
--net=host \
-v /etc/prometheus/prometheus.yml \
-v /data/prometheus \
prom/prometheus \
--config.file="/etc/prometheus/prometheus.yml" \
--storage.tsdb.path="/data/prometheus"
Here is an explanation of all the parameters provided in this command.
- -d : stands for detached mode. The container will run in the background. You can have a shell to run commands in the container, but quitting it won’t stop the container.
- -p : stands for port. As containers are running in their own environments, they also have their own virtual networks. As a consequence, you have to bind your local port to the “virtual port” of Docker (here 9090)
- -v : stands for volume. This is related to “volume mapping” which consists in mapping directories or files on your local system to directories in the container.
- –config.file : the configuration file to be used by the Prometheus Docker container.
- –storage.tsdb.path : the location where Prometheus is going to store data (i.e the time series stored).
- –net: we want the Prometheus Docker container to share to same network as the host. This way, we can configure exporters in individual containers and expose them to the Prometheus Docker container.
To make sure that everything is running properly, list the running containers on your instance.
$ docker container ls -a
CONTAINER ID        IMAGE               COMMAND                         CREATED              STATUS              PORTS                        NAMES
gfre156415ea78      prom/prometheus     "/bin/prometheus --con.."       About a minute ago   Up
0.0.0.0:9090 ->9090/tcp      modest_hypatia
As you can see, my container is up and running.
Want an interactive shell running to access your Prometheus Docker?
docker exec -it <container_id> /bin/sh
If your container is not running, it is probably marked as “Exiting” in the status column. If this is case, here is a command to inspect what happened during the initialization of the container.
$ docker container logs -f --since 10m <container_id>
8/29/2019 @ 11:11:00 - Port already in use : 9090
This command is very handy when something wrong happens on your container.
However, if your container is up, you should have access to the Prometheus Web UI, located by default at http://localhost:9090.
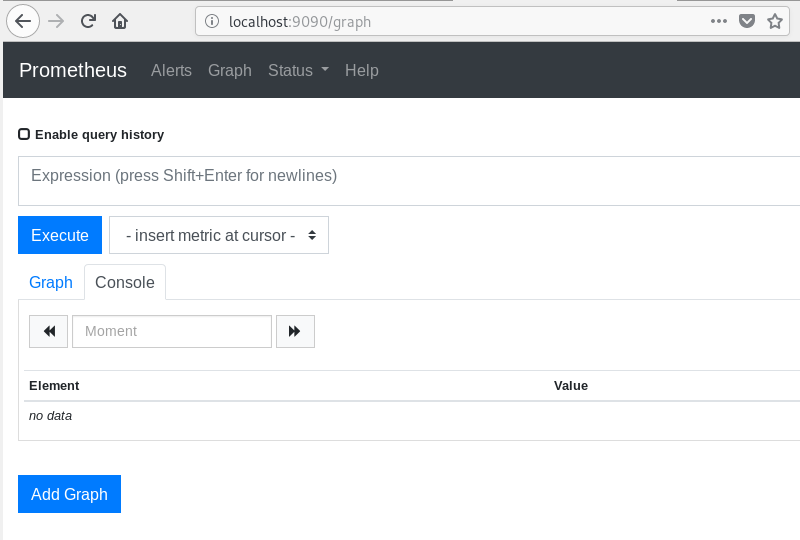
As Prometheus is already scrapping itself, you should see it as a target in the “Status > Targets” panel.
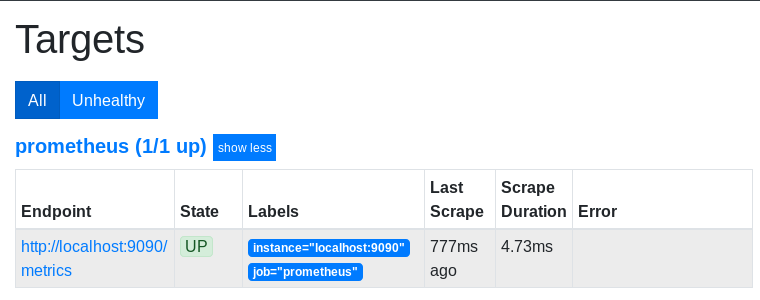
Congratulations, you successfully installed Prometheus on Docker.
However, Prometheus alone isn’t very useful. As a consequence, we are going to install the Node exporter : an exporter responsible for gathering and aggregating metrics related to Linux system performance.
3. Installing the Node Exporter on Docker
The Node exporter also comes with its own Docker image.
Similarly to what we did with the Prometheus Docker image, let’s create a user for the Node Exporter.
a – Prepare the Node Exporter for Docker
$ $ sudo useradd -rs /bin/false node_exporterAgain, to launch the container properly, you will have to get the Node Exporter user ID. To do it, run
$ cat /etc/passwd | grep node_exporter
prometheus:x:995:995:/home/node_exporter:/bin/false
b – Running the Node Exporter Docker image
The Node Exporter does not have a dedicated configuration file.
Instead, it relies on flag provided to the command line to enable or disable collectors. By default, a lot of them are enabled by default (you can find the list here) but some of them are not.
To enable them, you will have to provide a –collector.<name> flag to the command-line.
Before running the node exporter image, make sure that nothing is running on port 9100 (the default Node Exporter port).
$ sudo netstat -tulpn | grep 9100You will have to map certain directories on your filesystem to the Node Exporter image.
Indeed, if you don’t map the correct folders, you are going to monitor the filesystem of your Docker image, which is not what we want in this case.
To run the Node Exporter image, run the following command
docker run -d -p 9100:9100 --user 995:995 \
-v "/:/hostfs" \
--net="host" \
prom/node-exporter \
--path.rootfs=/hostfs
Here are the details of the flags provided to this command.
- -d: detached mode, will run the node exporter even if we are not directly interacting with it;
- -p: as the node exporter runs on port 9100, we are going to expose this port to Prometheus;
- –user: the node exporter user ID, for security purposes.
- -v: the host filesystem (the machine you are monitoring) is mapped to a folder in the Docker image.
- –net: sets the Docker image and the host to share the same network.
- –path.rootfs: instructs the node exporter to look for the filesystem in the hostfs folder. This way, the Node exporter is not monitoring your Docker filesystem, but the mapped filesystem from your host.
c – Verify that the Node exporter is running
To verify that the Node exporter is running, make a simple curl call on your host.
$ curl http://localhost:9100/metrics

node_scrape_collector_success{collector="arp"} 1
node_scrape_collector_success{collector="bcache"} 1
node_scrape_collector_success{collector="bonding"} 1
node_scrape_collector_success{collector="conntrack"} 1
node_scrape_collector_success{collector="cpu"} 1
...
Great! It seems that the Node Exporter is running correctly. Make sure that the Node exporter is actually scrapping your host and not the Docker image.
$ curl http://localhost:9100/metrics | grep uname

node_uname_info{domainname="(none)",machine="x86_64",nodename="schkn-debian",release="4.15.0-42-generic",sysname="Linux",version="#45-Ubuntu SMP Thu Nov 15 19:32:57 UTC 2018"} 1
As you can see, the nodename is correct and the version is also correct. The Node exporter is correctly scrapping my host, and not the Docker container itself.
d – Bind Prometheus to the Node Exporter
Now that the Node Exporter and Prometheus are running separately, it is time to bind Prometheus to the Node Exporter to start storing our metrics.
Head over to your Prometheus configuration file, and append the following changes.
# A scrape configuration scraping a Node Exporter and the Prometheus server
# itself.
scrape_configs:
  # Scrape Prometheus itself every 10 seconds.
  - job_name: 'prometheus'
    scrape_interval: 10s
    target_groups:
      - targets: ['localhost:9090']

  - job_name: 'node_exporter'
    scrape_interval: 10s
    target_groups:
      - targets: ['localhost:9100']
Make sure that you create a new scrape configuration for node exporter. This way, metrics are going to be correctly labeled and they will be easily retrievable.
There is no need to restart the Prometheus Docker container for the modifications to be applied.
To restart your Prometheus configuration, simply send a SIGHUP signal to your Prometheus process.
First, identify the PID of your Prometheus server.
$ ps aux | grep prometheus
schkn  4431  0.0  0.0  14856  1136 pts/0    S+   09:34   0:00 /bin/prometheus --config.file=...
The PID of my Prometheus process is 4431. Send a SIGHUP signal to this process for the configuration to restart.
$ sudo kill -HUP 4431Now, your Prometheus instance should have the Node Exporter as a target. To verify it, head over to http://localhost:9090 and verify that it is the case.
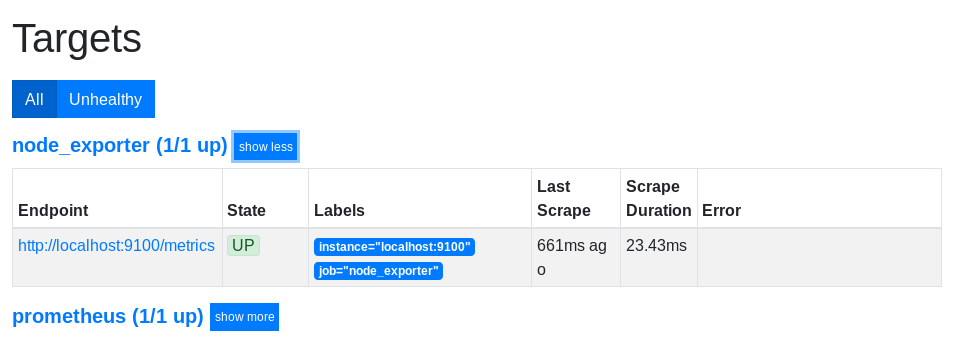
As you can see, the node exporter target is up and running.
Now that your system is monitored using Prometheus and the Node Exporter through Docker, let’s have a quick Grafana installation to visualize our metrics.
4. Installing Grafana on Docker
Installing Grafana on Docker is pretty straightforward. Here is the command to get it.
a – Getting the Grafana image
$ docker run -d -p 3000:3000 --net=host grafana/grafanaNote : do not forget the net option, otherwise your Grafana instance is not going to find your Prometheus instance running on your host.
If your Docker image cache doesn’t have the Grafana image, it is going to retrieve it, to store it and to create a Grafana docker on your host.
When the installation is done, head over to http://localhost:3000 (the default port for Grafana)
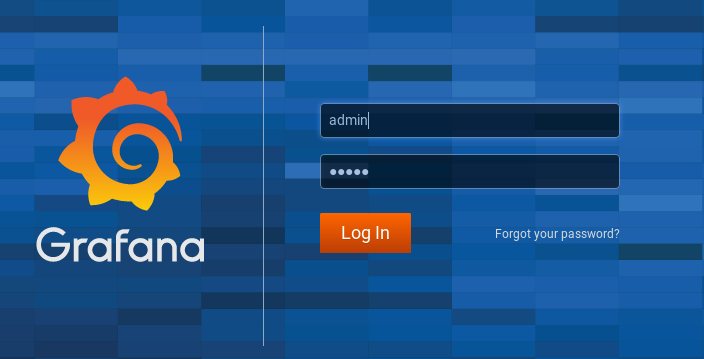
By default, the credentials are admin for the username and admin for the password.
By clicking on “Log In”, you are asked to change the default password. Choose a strong one, and click on “Save“.

b – Add Prometheus as a datasource
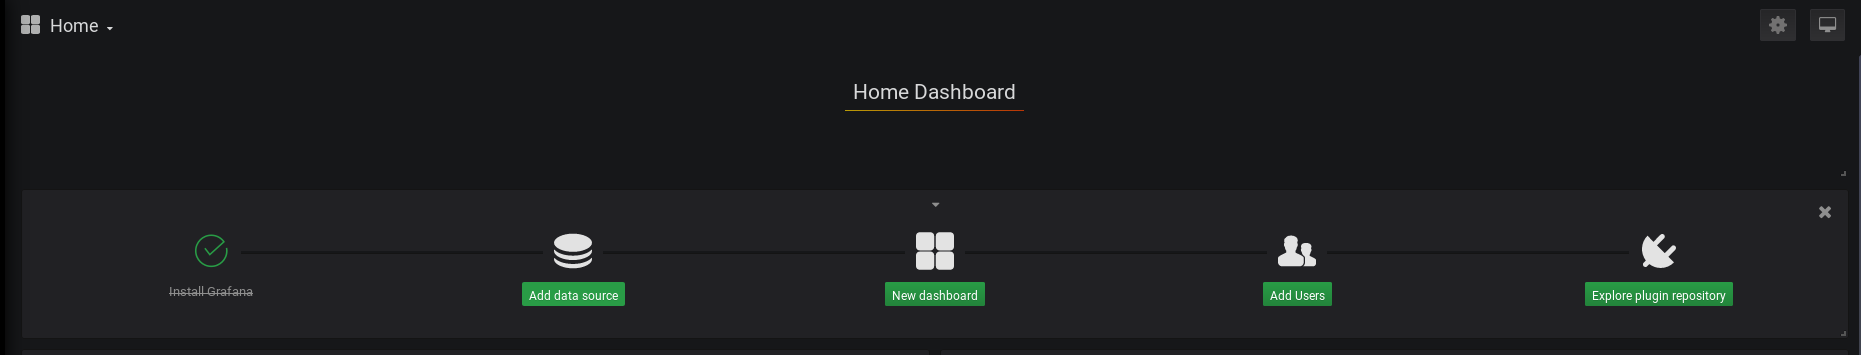
By default, you will be redirected to the Homepage. Click on the “Add a datasource” option.
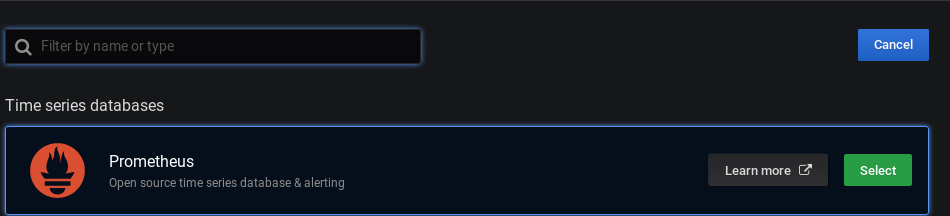
Choose a Prometheus datasource and click on “Select“
Here is the configuration for your Prometheus host.
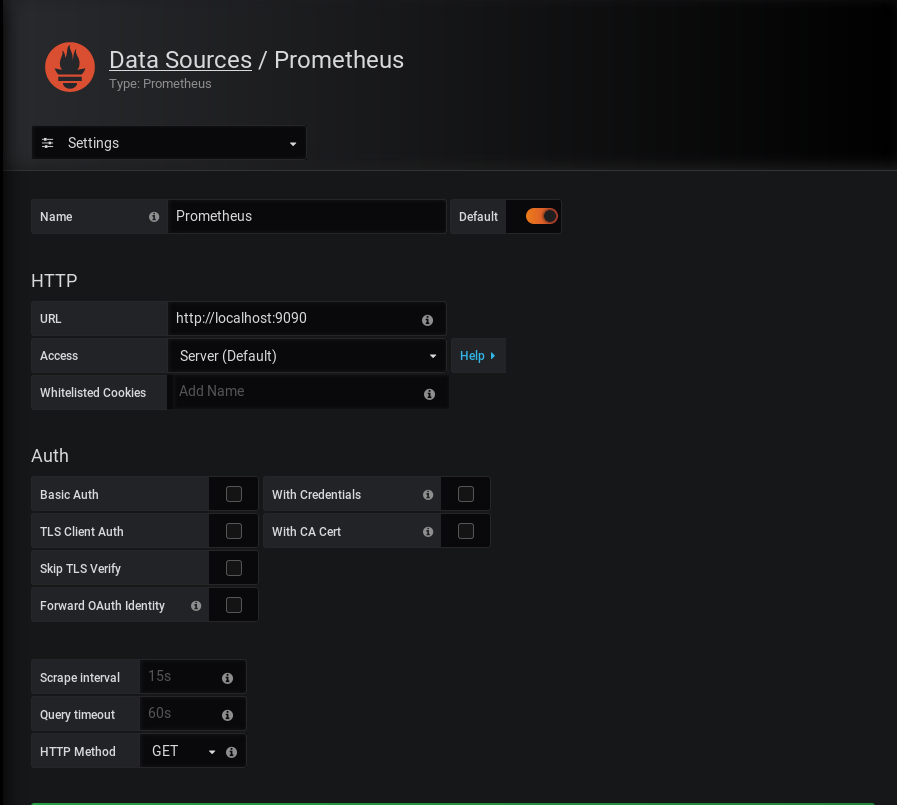
Click on “Save and Test” and make sure that your Prometheus configuration is running properly.

c – Import the Node Exporter dashboard
As the Node exporter is quite a popular exporter, there are developers who already created dashboards for it.
As a consequence, we are going to install the Node Exporter dashboard on Prometheus.
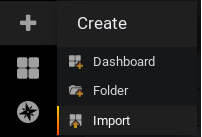
In the left menu, click on the “Plus” icon, then “Import”.
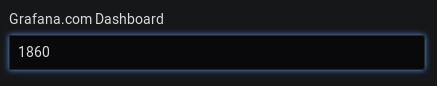
In the Grafana dashboard text box, type 1860 and wait for Grafana to retrieve the dashboard information automatically.
In the next window, select Prometheus as a datasource and click on “Import“.
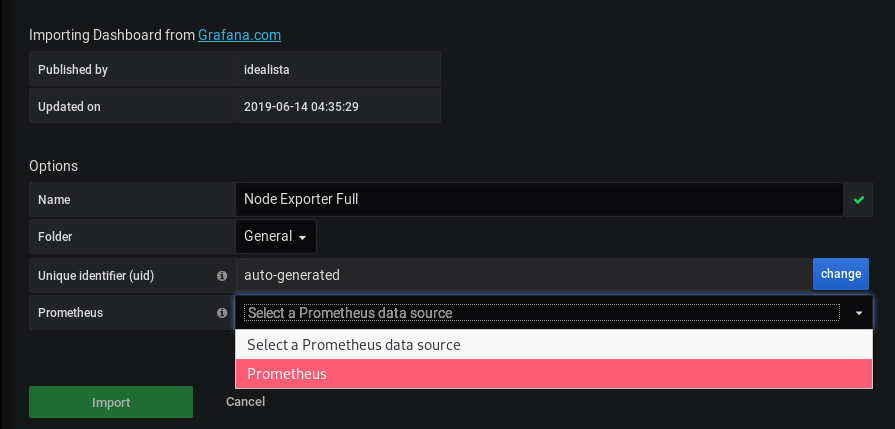
That’s it! Your dashboard should now automatically be created.
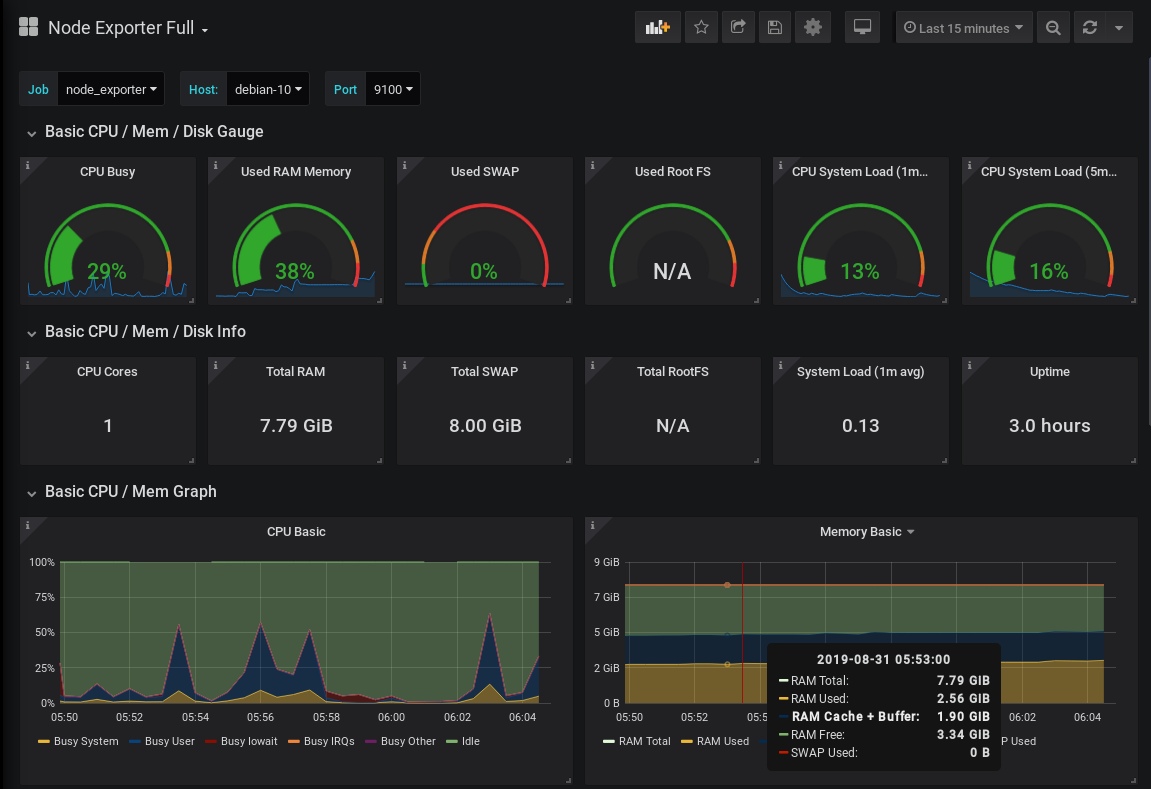
5. Going Further
As you can see, installing Prometheus on Docker is pretty easy.
We also covered how to install a simple exporter ana dashboard monitoring solution which is Grafana in this case.
This is a basic yet very effective set up for your monitoring architecture.
Are you interested in more monitoring tutorials? We have a dedicated category for it.
If you are looking for more Prometheus tutorials, we also got it covered.
I hope that you learnt something new today.
Until then, have fun, as always.
12 comments
[…] How To Install Prometheus with Docker on Ubuntu 18.04 […]
Hi! first of all thanks for the blog, I salute you from Argentina.
Just wanted to make a comment on the prometheus.yml file, I noticed that the config `target_groups` has been replaced for `static_configs`, preventing the example from working. That gave me a serious headache till I found the problem.
Would be really nice if you can update the blog.
Thanks!!
“To start Prometheus on Docker, run the following command.”
Must be “-v :” instead of “-v /etc/prometheus/prometheus.yml”.
sudo docker run -d -p 9090:9090 –user : –net=host -v /etc/prometheus/prometheus.yml:/data/prometheus/prometheus.yml -v /data/prometheus prom/prometheus –config.file=”/etc/prometheus/prometheus.yml” –storage.tsdb.path=”/data/prometheus”
Greetings form Argentina!
Thank you for this comment! Was banging my head trying to find the issue. Worked perfectly! This article should be updated to reflect Pablo’s comment.
Thanks Man! You are the life saver
You are welcome!
Could you please update this tutorial with alertmanager running on docker?
It should be noted that the Node Exporter should not be installed in a container because it won’t have access to the full host metrics unless properly configured.
@SCHKN Do we need docker-compose for installing and running prometheus with node exporter?
Not necessarily, you can run them independently. Docker compose can be used in order to have a container that runs individual instances of Prometheus and Node Exporter in the same isolated environment, but it
is really optional.
Thank Schkn, You save my time to configure node expoerter. I requesting you publish Cadvisor expoerter also for Container metrics.
Hi Schkn,
Thanks for this great post!
I was wondering why you are using the “`–user“` flag with docker command, and why with the user ID instead of the username…