This tutorial describes how to check SSL certification expiration using modern monitoring tools.
When setting up complete monitoring solutions, it is very likely that you had to secure the different parts with SSL certificates.
In my recent setup tutorials, for Prometheus or Telegraf, we had to create SSL certificates to make sure the communication between those agents and Grafana was secure.
However, as time passes, it is also very likely that those SSL certificates will expire, preventing us from visualizing our data.
What if we had a way to check SSL certificate expiration dates and be alerted when one of our certificates is about to expire?
This is exactly what we are going to do today.
We are going to a simple way to check SSL certificate expiration dates with Prometheus and Grafana
When we are done, we will also design a dashboard for SSL certificates and alerts to see which one of them is approching its expiration time.
Ready?
I – What You Will Learn
Those are the concepts that you are going to learn if you follow this tutorial until the end.
- How to setup Prometheus and Grafana easily
- How to install the node-cert exporter to monitor your SSL certificates.
- How to design a Grafana dashboard to visualize SSL certificate expirations.
- How to raise alerts when your SSL certificates are about to expire.
That’s a long program, let’s start working.
II – Installing Prometheus & Grafana
The complete Prometheus & Grafana installation has already been covered in one of our previous articles.
It explains how to setup your Prometheus monitoring instance, how to secure it using HTTPS and how to bind it securely to Grafana.
You can skip the reverse proxy steps, but it is highly recommended to setup a NGINX reverse proxy for safety purposes.
When you are done, you are ready to go to step two.
III – Installing the node-cert exporter in Prometheus
Now that our Prometheus & Grafana stack is ready, it is time to install the node-cert exporter.
The node-cert exporter is an exporter that will periodically check your SSL certificates given a set of filesystem paths.
It is highly recommended to store your SSL certificates in the /etc/ssl folder, but you may store them in different places.
a – Download the node-cert exporter
To download the node-cert exporter, run a simple wget command.
$ wget https://github.com/amimof/node-cert-exporter/releases/latest/download/node-cert-exporter-linux-amd64If you like using the node-cert, make sure to star amimof’s work on Github.
You should now have the node-cert-exporter executable on your instance.
Move this executable to your /usr/local/bin folder and make it executable, at least for the owner of the file.
$ sudo mv node-cert-exporter-linux-amd64 /usr/local/bin
$ sudo chmod u+x /usr/local/bin/node-cert-exporter-linux-amd64
Create a user for the node-cert exporter.
$ sudo useradd -rs /bin/false node-cert-exporterMake the node-cert-exporter user the owner of the exporter executable.
$ sudo chown node-cert-exporter:node-cert-exporter /usr/local/bin/node-cert-exporter-linux-amd64This should be the content of your bin folder.

b – Install the node-cert exporter as a service
As always, we are going to install the exporter as a service.
Running exporters as a background process is the best way to crash them. Plus, you can monitor your systemd services and be notified when one goes down.
As always, head to the /lib/systemd/system folder, and create a node-cert service file in there.
$ cd /lib/systemd/system
$ sudo touch node-cert-exporter.service
The node-cert exporter uses the path flag to specify where your certificates are located on your system.
In my case, I am going to suppose that my certificates are located in the /etc/ssl/certs folder.
Make sure to finetune the path flag for your own SSL path.
Here is the content of the service file.
[Unit]
Description=Node Cert Exporter
Wants=network-online.target
After=network-online.target

[Service]
Type=simple
User=node-cert-exporter
Group=node-cert-exporter
ExecStart=/usr/local/bin/node-cert-exporter-linux-amd64 \
    --path=/etc/ssl/certs

Restart=always

[Install]
WantedBy=multi-user.target
Enable your service, and start it.
$ sudo systemctl enable node-cert-exporter
$ sudo systemctl start node-cert-exporter
Great!
Let’s have a look at the metrics exposed by the node-cert exporter.
$ sudo lsof | grep LISTEN | grep node-cert
Given the information of the last column, we can see that the node-cert exposes metrics on the port 9117.
Let’s do a quick curl command to see if it is aggregating metrics correctly.
$ curl http://localhost:9117/metricsIf you are seeing metrics named “ssl_certificate_expiry_date“, congratulations!
Your node-cert exporter is correctly installed.

c – Binding your exporter to Prometheus
Now that your node-cert exporter is correctly running, you need to bind it to Prometheus.
To do so, navigate to your Prometheus configuration file, and start editing it to add the following targets.
$ cd /etc/prometheus
$ sudo vi prometheus.yml
In the static_configs part of your configuration file, add a new entry for the cert exporter.
static_configs:
            - targets: ['localhost:9090', 'localhost:9117']
Restart Prometheus for your changes to be applied.
$ sudo systemctl restart prometheusDon’t forget to verify that Prometheus is actively scraping your new target.
Head over to http://localhost:1234/targets (if you followed the Prometheus and Grafana tutorial).
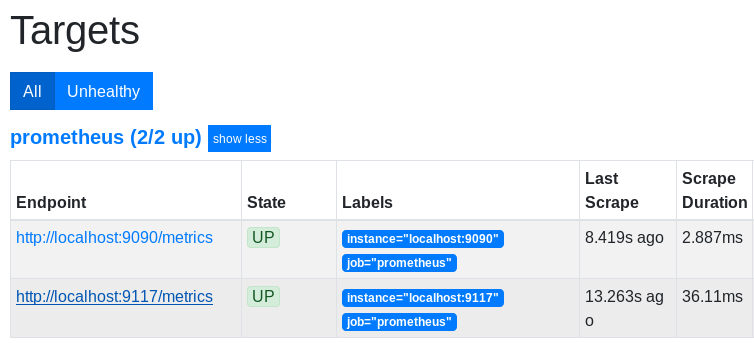
Awesome! The exporter is up and running.
Time to check the SSL certificate expirations in Grafana.
IV – Creating a Grafana dashboard
In order to visualize SSL certification expiration dates, we are going to use a predefined dashboard built by the creator of the exporter.
a – Import a Grafana dashboard
To import a Grafana dashboard, click on the Import option available in the left menu.
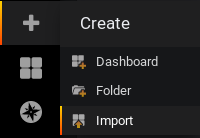
In the next window, choose to import your dashboard given a dashboard ID.
The dashboard ID for the node-cert dashboard is 9999.
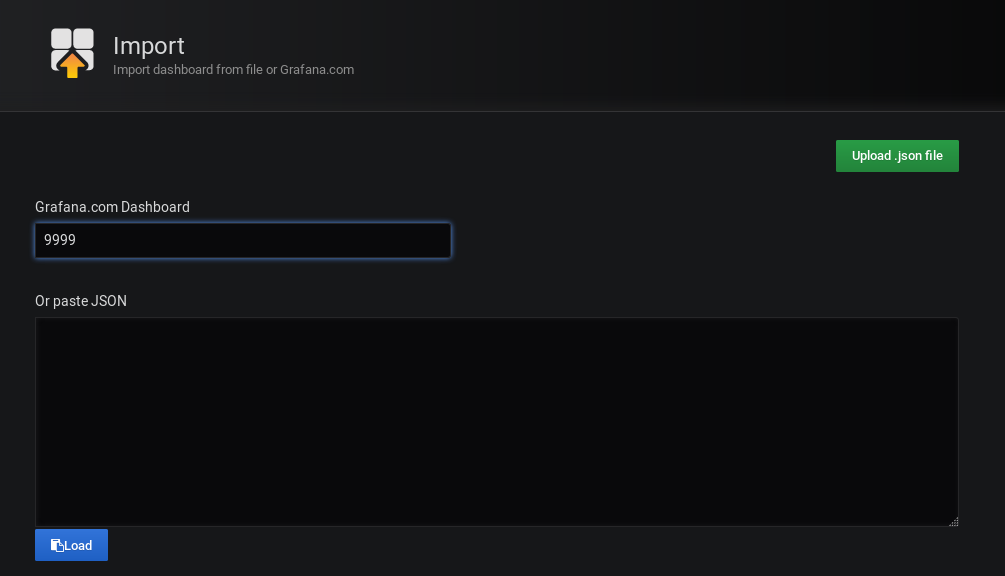
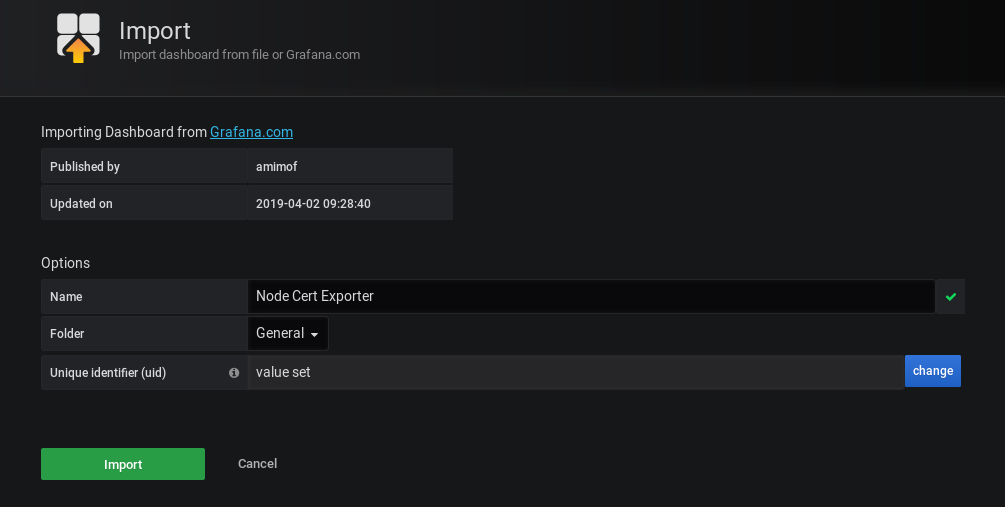
From there, Grafana should automatically detect that you are trying to import the dashboard.
This is what you should see.
b – Write a PromQL query for SSL certificate expiration
By default, the dashboard is not fully loaded in Grafana.
For some reasons that I ignore, the PromQL query is not actively loaded. That’s not a big problem, we are going to write it our way.
Edit the table panel in your dashboard.
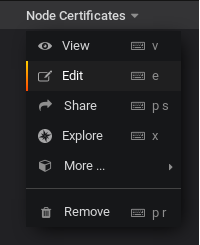
Go to the query panel, select Prometheus as a datasource and write the following PromQL query.

Important note : do not forget to check the “Instant” option on the second line of your query panel (otherwise you won’t be able to see anything)
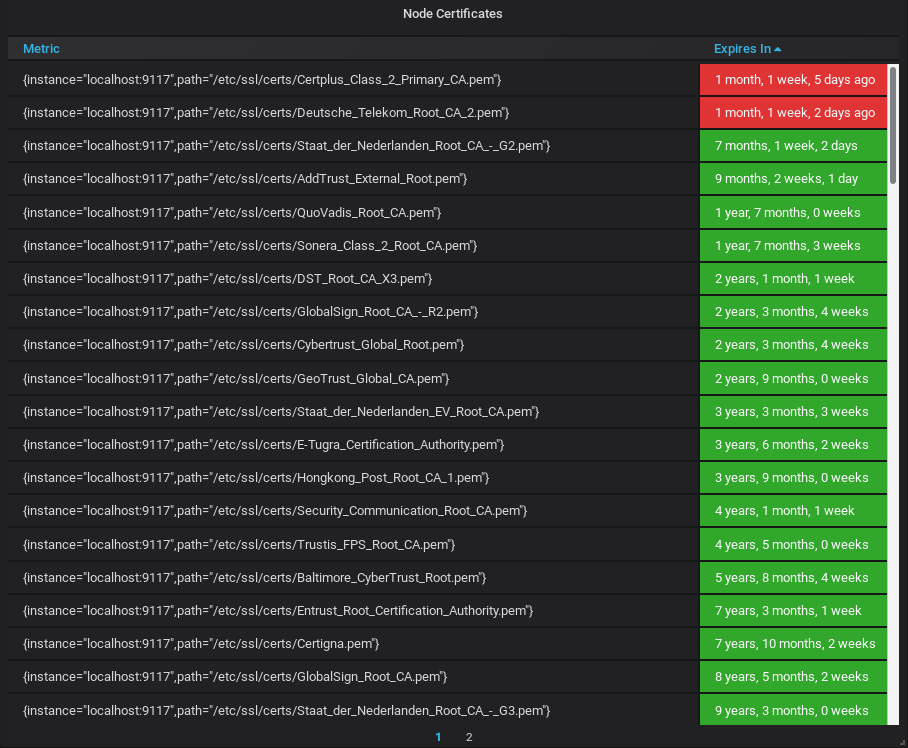
This is what you should now see on your dashboard.
Awesome!
You now have a dashboard checking your SSL certificates with pleasing colors.
As you can see, most of my certificates are safe, but some of them will have to be renewed in a month or so.
c – Customizing the threshold levels
As you can see, some thresholds are already defined in this Grafana dashboard.
By default, red lines will be displayed for SSL certificates that need to be renewed in less than three months, orange lines between three months and six months, and green lines for more than six months.
Would you like to customize those levels?
Let’s have red lines for expirations in less than one week, and orange between one week and one month.
To customize it, head over to the “Visualization” panel in Grafana and search for the corresponding option line.

The levels are stored in the “Thresholds” text field.
The current values are 7889231 seconds (3 months) and 15778463 seconds (6 months).
Let’s modify this text field for 2592000 (1 month) and 25920000 (10 months).
604800,2592000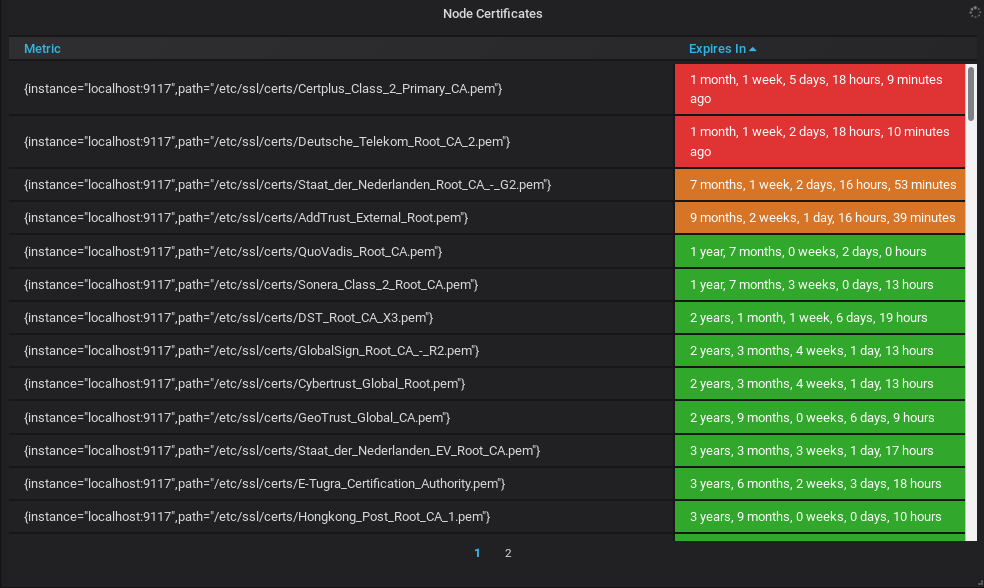
V – Firing alerts when SSL certificates expire
If you are to check your SSL certification expiration dates, it is very likely that you are not going to take a look at your dashboard every day.
You want to be alerted when one of your certificate is about to expire.
Make sure to install the AlertManager with Prometheus by following this tutorial.
a – Creating a rules file
In your Prometheus folder, create a “alerts” folder. This is the place where you are going to store all your alert files.
Go to your alerts folder, and create a new file named “ssl_rules.yml“.
$ cd /etc/prometheus
$ sudo mkdir alerts && cd alerts
$ sudo nano ssl_rules.yml
In the file, paste the following content.
groups:
  - name: ssl_expiry.rules
    rules:
      - alert: SSLCertExpiringSoon
        expr: sum(ssl_certificate_expiry_seconds{}) by (instance, path) < 86400 * 30
        for: 10m
The following configuration will fire an alert when you need to check your SSL certificate (one month away from being expired)
As a reminder, the Prometheus server is going to be used as a client for the Alert Manager.
b – Create an AlertManager rules file
The AlertManager installation and configuration for Prometheus was already covered in our previous tutorials so make sure to check it.
Now we are going to create a rules file for the AlertManager.
For this part, we are going to use Slack as a recipient, but you could send an email, or use PagerDuty for example.
If you are looking to create a Webhook for Slack and Prometheus, here’s a link to create it.
Go to your /etc/alertmanager folder and create a new file named “alertmanager.yml“.
$ cd /etc/alertmanager
$ sudo touch alertmanager.yml
Paste the following content in your file (change the webhook URL for the one provided by your Slack workspace)
global:
  resolve_timeout: 5m

route:
 group_by: ['SSLCertExpiringSoon']
 group_wait: 10s
 group_interval: 10s
 repeat_interval: 1h
 receiver: slack


receivers:
- name: slack
  slack_configs:
  - api_url: $WEBHOOK_URL
    channel: '#devconnecteds-blog'
Save your file, and make sure that your AlertManager service is launched with the correct option (with the correct –config flag)
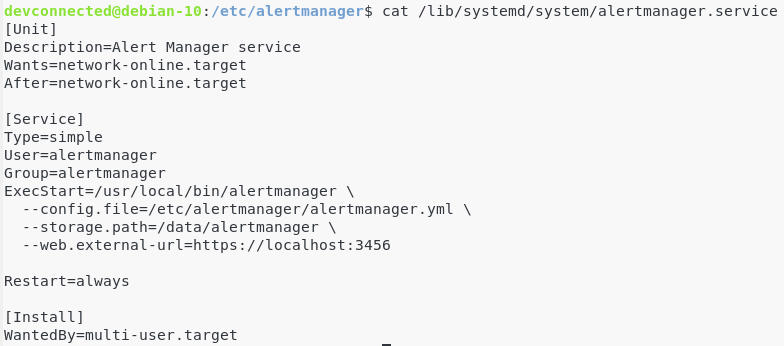
Restart your AlertManager service.
$ sudo systemctl restart alertmanagerc – Getting AlertManager alerts on Slack
Now that our configuration is set, it is time to have an alert firing on the Prometheus server.
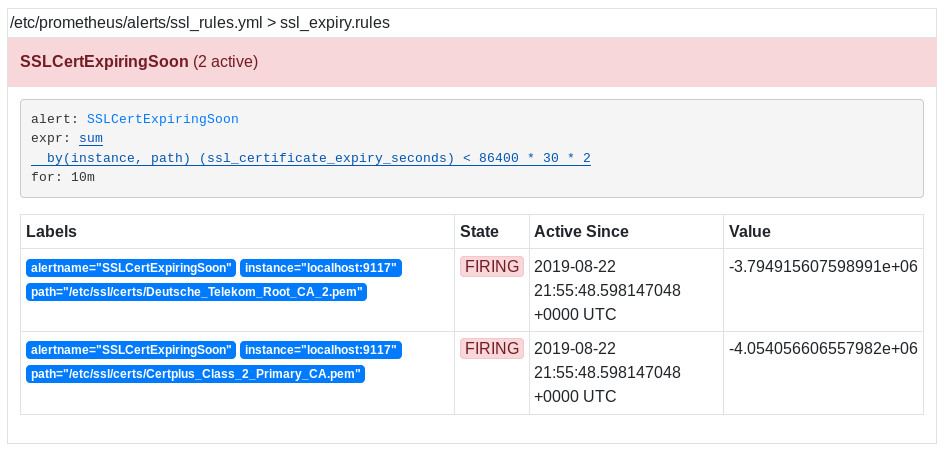
As you can see, two alerts are already firing on my Prometheus alerts tab.
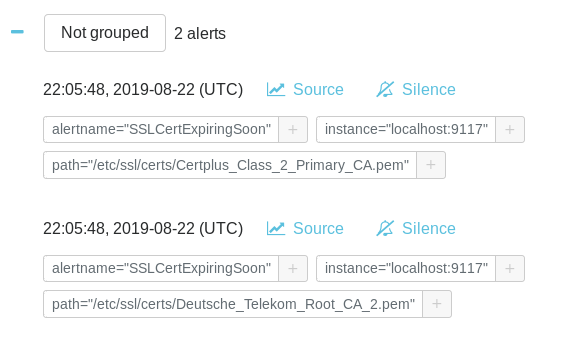
On the AlertManager, this is what you should see.
Finally, you should receive your alerts on Slack. In this case, they are grouped, but you can modify this option in your rules file (by replacing the group by option).
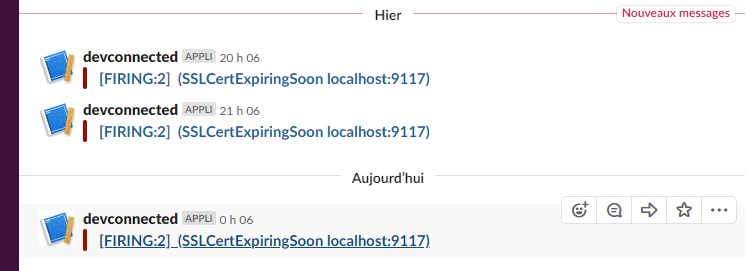
Awesome! You are now notified when you have to check your SSL certificates.
VI – Alternatives
Alternatives to Prometheus and Grafana exist to check your SSL certificate expiration.
David McKay, developer advocate for InfluxData, wrote an article on how to check your SSL certificates using Telegraf and InfluxDB.
This is more or less the same principle, except that you would have to use an InfluxDB datasource in Grafana.
If you are not sure about how to setup the TIG stack, here how to install InfluxDB and Grafana on Linux.
Free services also exist if you are looking to monitor your SSL certificates online. Certificate Expiry Monitor is one of them as an example.
Are you going to start using Prometheus to monitor your SSL certificates?
I hope that you learned something new today.
Until then, have fun, as always.


5 comments
Hi schkn,
First of all thanks for your articles. They are all very clear.
I’ve successfully setup Grafana I’m getting all my certificates expiration date in the dashboard, and also AlertManager.
However somehow I’m facing an issue that I can’t seem to be able to solve on my own.
On AlertManager I never see any alert, all I have is “No alert groups found”.
I’ve tried triggering my alerts by changing the “expr: sum(ssl_certificate_expiry_seconds{}) by (instance, path) < 86400 * 30".
I've 30 by 60 knowing that some of my certificates are about to expire in just over a month, but still nothing.
There is something I might have mist, the ssl_rules.yml does not seem to be called in any other config such as altermanger.yml.
I'm I missing something ?
Thanks again,
Regards
Hello, thank you for your comment.
Checking on this article by Grafana, the “ssl_rules.yml” file should be specified in the “prometheus.yml” configuration file under the “rules” section.
Have you specified this parameter in your configuration file?
Best,
https://grafana.com/blog/2020/02/25/step-by-step-guide-to-setting-up-prometheus-alertmanager-with-slack-pagerduty-and-gmail/
Hi Schkn
Before all, thank you for this tuto. But I have one problem (and no log of course)
I added in node-cert-exporter.service, the following path:
ExecStart=/usr/local/bin/node-cert-exporter-linux-amd64 \
–path=/etc/ssl/certs, /etc/letsencrypt/live/backoffice/
# HELP ssl_certificate_expiry_failed files that were failed to process
# TYPE ssl_certificate_expiry_failed gauge
ssl_certificate_expiry_failed{hostname=”auvray”,nodename=””,path=”/etc/letsencrypt/backoffice/”} 0
# HELP ssl_certificate_expiry_seconds Number of seconds until certificate expires
# TYPE ssl_certificate_expiry_seconds gauge
ssl_certificate_expiry_seconds{alg=”ECDSA-SHA256″,dns_names=””,email_addresses=””,hostname=”backoffice”,issuer=”CN=Amazon Root CA 3,O=Amazon,C=US”,nodename=””,path=”/etc/ssl/certs/Amazon_Root_CA_3.pem”,subject=”CN=Amazon Root CA 3,O=Amazon,C=US”,version=”3″} 6.114898789804966e+08
ssl_certificate_expiry_seconds{alg=”ECDSA-SHA256″,dns_names=””,email_addresses=””,hostname=”backoffice”,issuer=”CN=GlobalSign,OU=GlobalSign ECC Root CA – R4,O=GlobalSign”,nodename=””,path=”/etc/ssl/certs/GlobalSign_ECC_Root_CA_-_R4.pem”,subject=”CN=GlobalSign,OU=GlobalSign ECC Root CA – R4,O=GlobalSign”,version=”3″} 5.373703259693444e+08
Rights are well, user node-cert-exporter exists, all /etc/ssl/certs are visible in the dashboard, but not those of letsencrypt.
Do you have an idea ?
Thanks you
Hello, thank you for your comment.
From what I remember, only “.pem” files are supported by this exporter. Are the files in the backoffice folder pem ones?
Hi Schkn,
Files in folder backoffice are all in good format *.pem.
I renamed my fullchain.pem and moved it to /etc/ssl/certs, and it works .. I did the same thing yesterday…
I don’t understand.. Same rights …
It doesn’t matter, thanks for your help.