
Whether you are a database administrator, or an web application developer, it is very likely that your infrastructure relies on MongoDB in some ways.
As a consequence, monitoring MongoDB is crucial to ensure that you are not having performance or memory issues with your database.
In 2019, there are many ways to monitor your MongoDB instance.
Today, we are taking a look at how to monitor your MongoDB database with Grafana and Prometheus.
Ready?
I – What You Will Learn
As always, here are the key points that you will learn if you follow this tutorial until the end:
- How to install Prometheus, a modern time series database on your computer;
- How to setup the MongoDB developed by Percona as well as binding it to MongoDB;
- What your Grafana – Prometheus – MongoDB exporter will look like
- How to configure import a MongoDB dashboard in seconds
Note : Percona’s MongoDB exporter includes MongoDB stats for sharding and replica, as an evolution of David Cuadrado’s MongoDB exporter
II – MongoDB, Grafana and Prometheus Architecture
Similarly to the architecture we described in our MySQL monitoring tutorial, here’s a complete overview of what the final monitoring architecture looks like.
As a quick reminder, Prometheus scrapes targets. Targets may be instrumented applications (like instrumented Java apps for example), the Pushgateway or exporters.
Exporters are a way to bind to an existing entity (a database, a reverse proxy server, an application server) to expose metrics to Prometheus.
The MongoDB exporter is one of them.
Prometheus will bind to the MongoDB exporters and store related metrics in its own internal storage system.
From there, Grafana will bind to Prometheus and display metrics on dashboard panels.
Easy, isn’t it?
Now that you have a great understanding of what we are trying to build, let’s install the different tools needed to monitor MongoDB.
III – Installing The Different Tools
a – Installing Prometheus
If you are still a beginner using Prometheus, you will find the complete Prometheus installation on this tutorial.
If you run the Prometheus installation entirely, you know have your Prometheus up and ready.
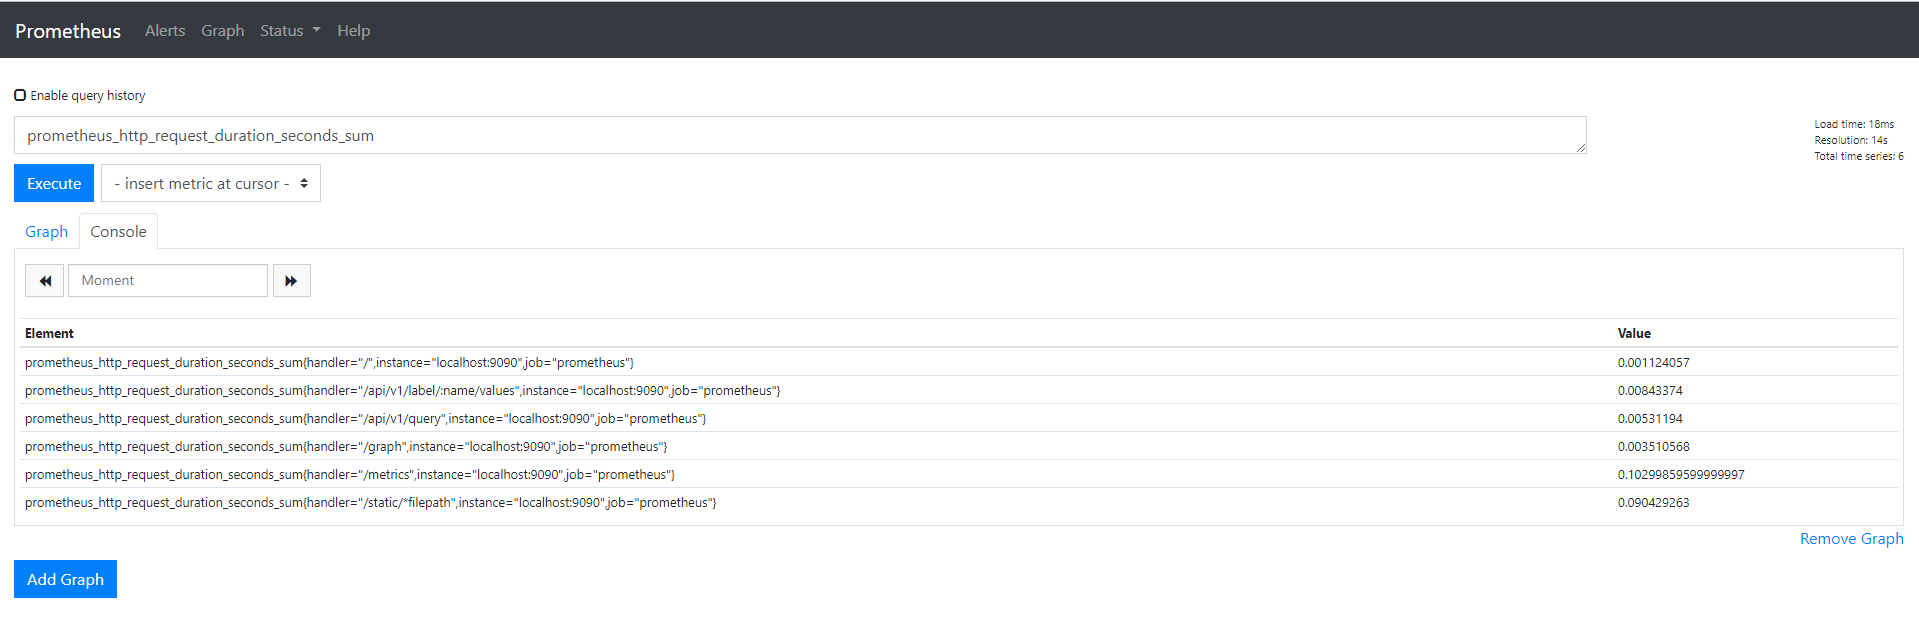
To verify it, head over to http://localhost:9090. If you have a web interface close to the one presented just below, it means that your installation went correctly.
No metrics are currently stored, except maybe Prometheus internal metrics.
Run a simple prometheus query, such as prometheus_http_request_duration_seconds_sum and make sure that you have some results.
Now that your Prometheus server is running, let’s install the MongoDB exporter to start monitor our MongoDB database.
b – Installing the MongoDB exporter
As explained before, the MongoDB exporter is available on Percona’s GitHub here.
The MongoDB exporter comes as a binary file in an archive, but as always, we are going to configure it as a service.
We are also going to configure it to run on a specific authenticated user dedicated to monitoring.
First, download the MongoDB exporter release file from one of the versions available here.
$ mkdir mongodb-exporter
$ cd mongodb-exporter
$ wget https://github.com/percona/mongodb_exporter/releases/download/v0.7.1/mongodb_exporter-0.7.1.linux-amd64.tar.gz
Note : as of June 2019, the MongoDB exporter version is 0.7.1.
Next, extract the downloaded archive in your current folder.
$ tar xvzf mongodb_exporter-0.7.1.linux-amd64.tar.gzYou should now have 4 files: mongodb_exporter, LICENSE, README.md, CHANGELOG.md.
All files are pretty self explanatory, but we are only interested in the mongodb_exporter binary file here.
As we are going to configure the exporter as a service, create a dedicated user for Prometheus if not already existing.
$ sudo useradd -rs /bin/false prometheus
$ sudo mv mongodb_exporter /usr/local/bin/
c – Enabling MongoDB authentication
Every access to your MongoDB instance should be authenticated and authorized.
To ensure it, we are going to setup a basic MongoDB authentication for the MongoDB exporter.
MongoDB authentication is set using the –auth flag in the Mongo shell.
By default, mongod does not set this flag, so you should be able to connect to it via localhost.
$ ps aux | grep mongod
mongodb  13468  1.1  6.9 1490632 281728 ? Ssl  Jan05 2838:27 /usr/bin/mongod --unixSocketPrefix=/run/mongodb --config /etc/mongodb.conf
Connect to your MongoDB instance with mongo.
$ mongo --port 27017Create an administrator account for your exporter with the cluster monitor role.
use admin
db.createUser(
  {
    user: "mongodb_exporter",
    pwd: "password",
    roles: [
        { role: "clusterMonitor", db: "admin" },
        { role: "read", db: "local" }
    ]
  }
)
You should see the following message
Successfully added user: {
        "user" : "mongodb_exporter",
        "roles" : [
                {
                        "role" : "clusterMonitor",
                        "db" : "admin"
                },
                {
                        "role" : "read",
                        "db" : "local"
                }
        ]
}
Before exiting, shutdown your MongoDB instance, and restart it.
$ db.adminCommand( { shutdown: 1 } )
$ exit
$ sudo mongod --auth --port 27017 --config /etc/mongodb.conf &
Set your MongoDB URI environment variable, according to the changes that you made before.
$ export MONGODB_URI=mongodb://mongodb_exporter:password@localhost:27017d – Creating a service for the MongoDB exporter
Similarly to the MySQLd exporter, we are going to setup the MongoDB exporter as a service.
As usual, head over to /lib/systemd/system and create a new service file for the exporter.
$ cd /lib/systemd/system/
$ sudo touch mongodb_exporter.service
Parse the following configuration into your service file:
[Unit]
Description=MongoDB Exporter
User=prometheus

[Service]
Type=simple
Restart=always
ExecStart=/usr/local/bin/mongodb_exporter

[Install]
WantedBy=multi-user.target
From there, don’t forget to restart your system daemon and to start your service.
$ sudo systemctl daemon-reload
$ sudo systemctl start mongodb_exporter.service
You should always verify that your service is working.
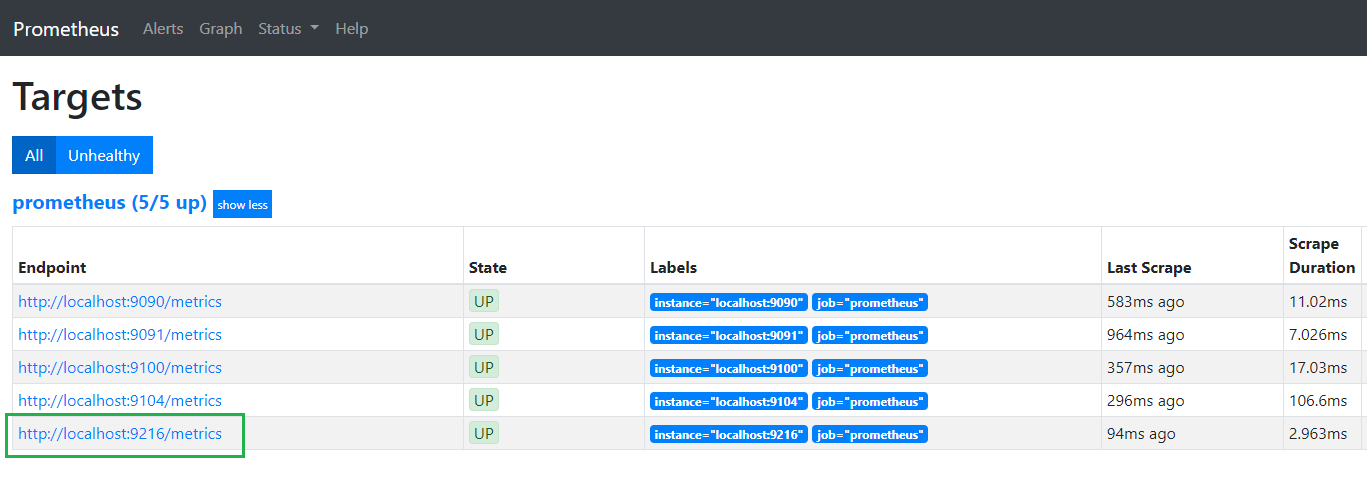
As a quick reminder, Percona’s MongoDB exporter runs on port 9216.
To ensure that everything is working correctly, run a simple curl command on the port 9216.
$ sudo curl http://localhost:9216/metrics
# HELP go_gc_duration_seconds A summary of the GC invocation durations.
# TYPE go_gc_duration_seconds summary
go_gc_duration_seconds{quantile="0"} 0
go_gc_duration_seconds{quantile="0.25"} 0
go_gc_duration_seconds{quantile="0.5"} 0
go_gc_duration_seconds{quantile="0.75"} 0
go_gc_duration_seconds{quantile="1"} 0
go_gc_duration_seconds_sum 0
go_gc_duration_seconds_count 0
...
Can you already see some Prometheus metrics that are being aggregated already?
Great! Your MongoDB exporter is working!
We only need to bind it to Prometheus, and we should be all set.
e – Configure the MongoDB exporter as a Prometheus target
Almost there!
As described in the schema shown in the architecture section, we are going to bind Prometheus to the new MongoDB exporter.
Head over to the location of your Prometheus configuration file (mine is located at /etc/prometheus/prometheus.yml) and edit it to add the MongoDB exporter as a target.
# A scrape configuration containing exactly one endpoint to scrape:
# Here it's Prometheus itself.
scrape_configs:
  # The job name is added as a label `job=<job_name>` to any timeseries scraped from this config.
  - job_name: 'prometheus'
    static_configs:
            - targets: ['localhost:9090', 'localhost:9216']
Restart Prometheus, and go to http://localhost:9090/targets to verify that Prometheus is now binded to your newly added exporter.
Great! Everything is up and running now.
The last step will be to create a complete Grafana dashboard to have some insights on our metrics.
Looking for a tutorial to install Grafana? We got it covered in our last article.
III – Building Awesome MongoDB dashboards
As described before, we are going to use dashboards built by Percona in order to monitor our MongoDB instance on Grafana.
Percona provides multiple existing dashboards such as:
- MongoDB Overview;
- MongoDB ReplSet;
- MongoDB RocksDB;
- MongoDB WiredTiger;
- MongoDB MMAPv1
- MongoDB InMemory
For this part, we are going to focus on importing the MongoDB Overview dashboards into our Grafana instance.
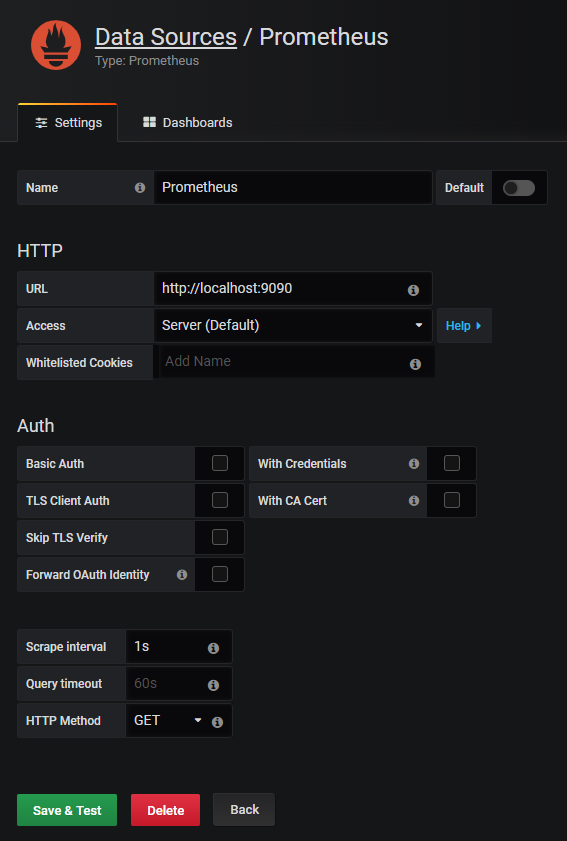
a – Set Prometheus as a Grafana datasource
If you followed our previous tutorials, you are probably a master at it right now.
If that’s not the case, here’s the configuration for Prometheus on Grafana.
b – Downloading Percona dashboards for Grafana
In Grafana, dashboards come as JSON files. When you create a dashboard, you can export it in this format and share it with the world.
Percona provides dozens of dashboards on its Github repository.
In this case, we are going to download the MongoDB Overview dashboard file.
Run a simple wget command to get the JSON file.
You can create a dedicated dashboards folder in your /etc/grafana folder to store your downloaded dashboards.
$ cd /etc/grafana
$ sudo mkdir dashboards
$ cd dashboards
$ sudo wget https://github.com/percona/grafana-dashboards/blob/master/dashboards/MongoDB_Overview.json
If you want all the dashboards available in the repository, simply clone the repository into your current folder.
$ sudo git clone https://github.com/percona/grafana-dashboards.gitNow that you have the JSON files available, it is time for us to import them into Grafana.
c – Importing the MongoDB dashboard in Grafana
For this example, we are going to import the MongoDB Overview dashboard for Grafana.
Head over to your Grafana instance, located at http://localhost:3000 (if you didn’t change any default ports in your configuration file)
On the left menu, hover the ‘Plus‘ icon with your mouse and click on Import.
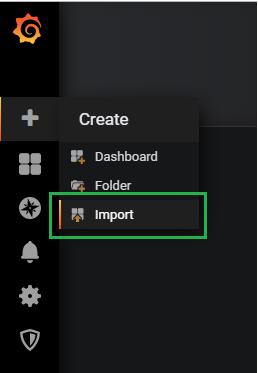
From there, you should be taken to the Import page. Click on the Upload .json file option.
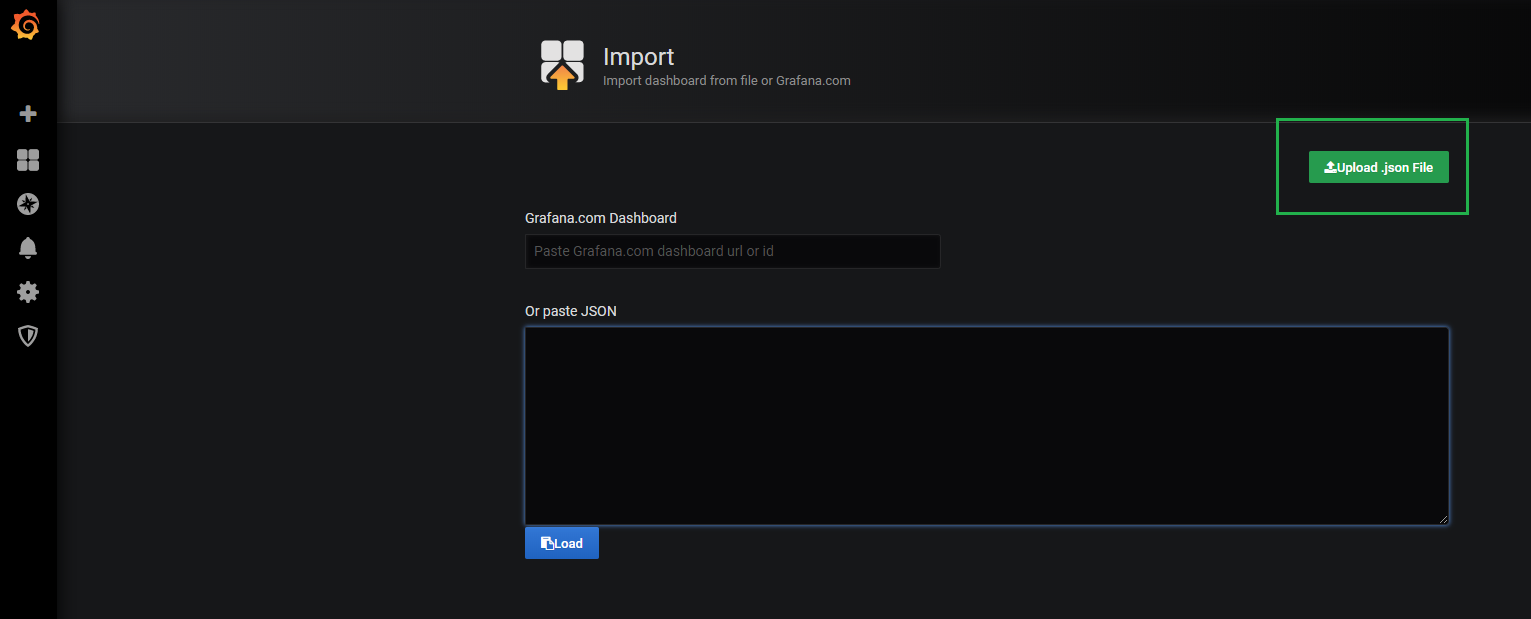
Given the operating system you are working with, navigate to the /etc/grafana folder (where you stored your dashboard), and click on the MongoDB_Overview.json file.
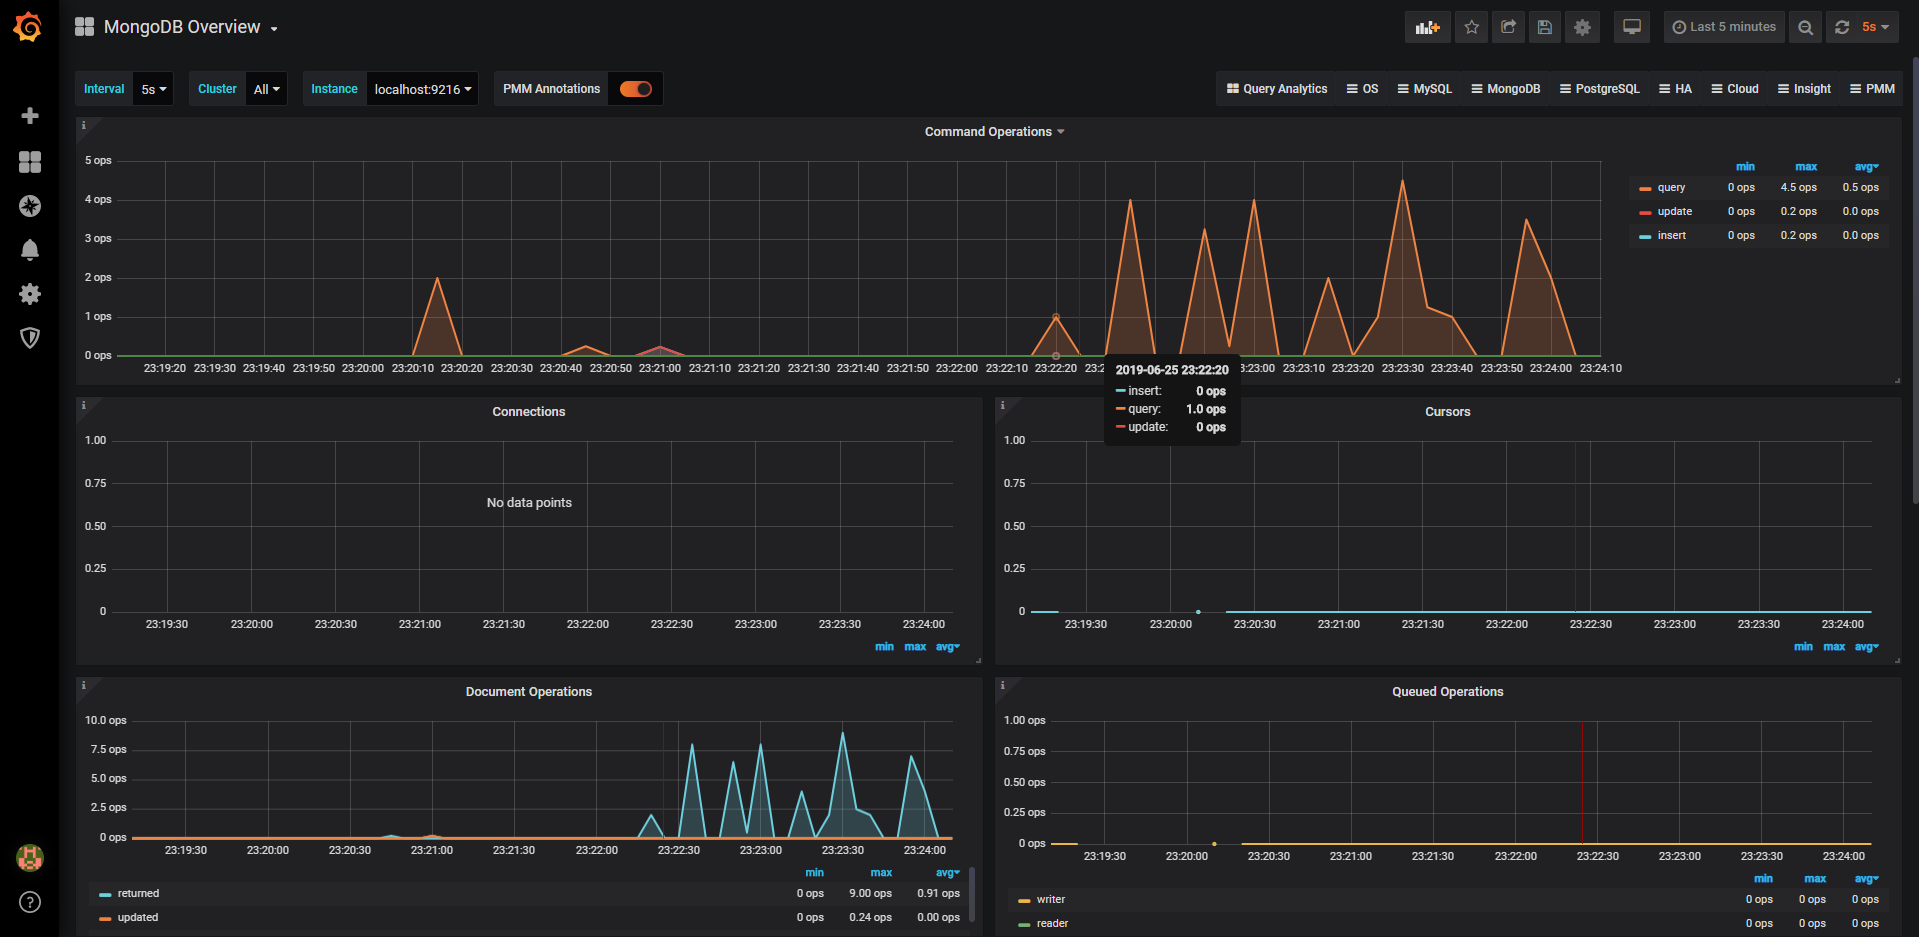
Your dashboard should be imported automatically, with real time updates of your MongoDB database!
IV – Common Errors
If you carefully followed this tutorial, chances are that you have a fully functional dashboard right now.
However, you might encounter some errors during the process.
Here are some clues on how to solve them:
- Failed to get server status: not authorized on admin to execute command
This error message is fairly simple to understand.
Your mongodb_exporter user does not have the necessary credentials to perform queries on the admin database.
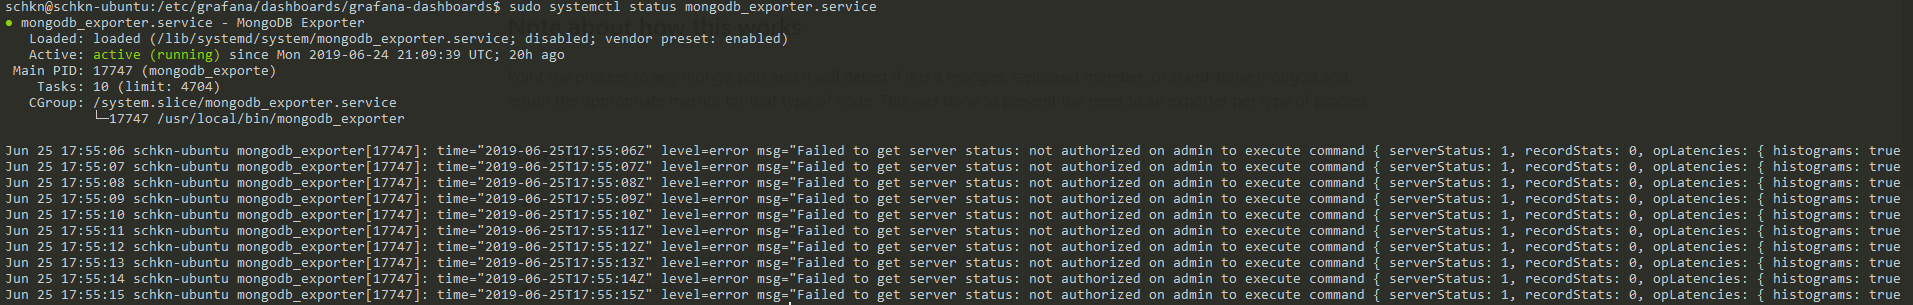
Clue 1
To resolve it, connect to your instance, use the admin database, and make sure that you configured correctly the mongodb_exporter user (it must have the cluster monitor right on the admin database)
$ mongo --port 27017 (or --auth if you already have an admin account on your database)
$ use admin;
$ db.getUsers()
{
        "_id" : "admin.mongodb_exporter",
        "user" : "mongodb_exporter",
        "db" : "admin",
        "roles" : [
                {
                        "role" : "clusterMonitor",
                        "db" : "admin"
                },
                {
                        "role" : "read",
                        "db" : "local"
                }
        ]
}
Clue 2
You didn’t not properly set the MongoDB URI environment variable.
To verify it, launch the following command:
$ env  | grep mongodb
MONGODB_URI=mongodb://mongodb_exporter:password@localhost:27017
Clue 3
If this is still not working, set the MongoDB URI directly in the service file, restart your service, as well as your MongoDB instance.
[Service]
Type=simple
Restart=always
ExecStart=/usr/local/bin/mongodb_exporter --mongodb.uri=mongodb://mongodb_exporter:password@localhost:27017

$ sudo systemctl daemon-reload
$ sudo systemctl restart mongodb.service
$ sudo systemctl restart mongodb_exporter.service- Could not get MongoDB BuildInfo: no reachable servers!
Clue 1
Your MongoDB database is either not launched, not it is not running on the port 27017.
For the first option, just verify that your MongoDB service is running, or that your mongod background is running.
$ sudo systemctl status mongodb.service
or
$ ps aux | grep mongod
For the second option, verify the port used by your MongoDB instance. To do so, run the following command:
$ sudo lsof -i -P -n | grep LISTEN
grafana-s   642         grafana    7u  IPv6  998256601      0t0  TCP *:3333 (LISTEN)
mysqld_ex  3136            root    3u  IPv6  998030854      0t0  TCP *:9104 (LISTEN)
mongod     3688            root   10u  IPv4 1092070442      0t0  TCP 127.0.0.1:27017 (LISTEN)
If your MongoDB instance is not running on the default 27017 port, change your mongodb_exporter file for it to bind to your custom port.
[Service]
mongodb.uri=mongodb://mongodb_exporter:password@localhost:12345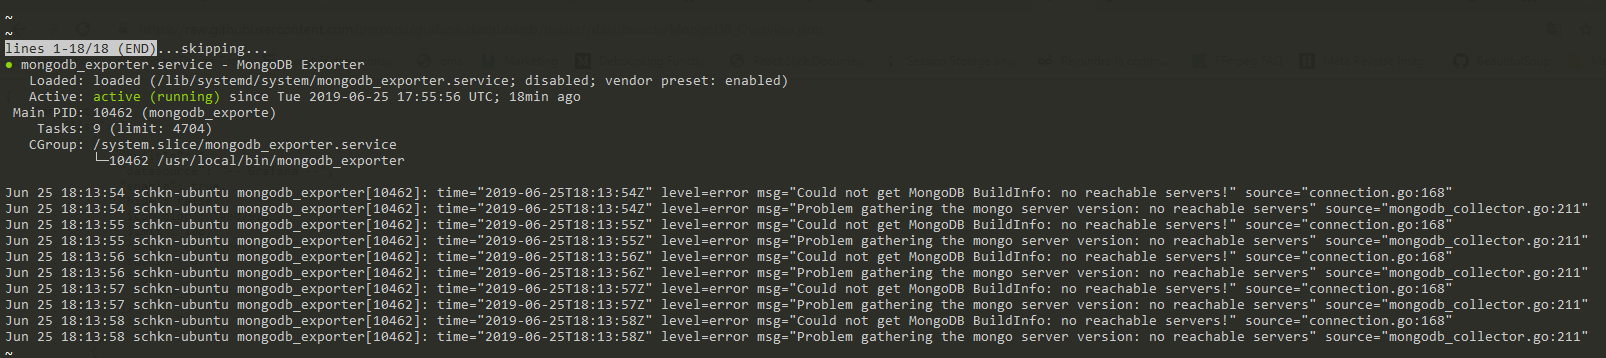
V – Going Further
Now that you have a fully operational monitoring pipeline for MongoDB, it is time for you to dig a little deeper.
Here are the best resources if you want to know more about MongoDB monitoring.
First, here’s a great talk by Vadim Tkachenko from Percona about Monitoring MySQL and MongoDB instances. You will understand how Percona builds its own monitoring architecture and their own dashboards.
This is a more general talk about MongoDB monitoring using the built-in commands available in your MongoDB CLI such as the server status, the stats, or the total size of each of your collections.
A great talk if you are not into custom monitoring solutions, and if you want to focus on native and already implemented functions.
13 comments
[…] MongoDB Monitoring with Grafana & Prometheus […]
[…] if you are looking for examples for MongoDB […]
Thanks a lot for sharing….
Hey Folks,
you have a small error – for mongodb_exporter service user ‘prometheus’ should be in [Service] block
Hi, when I use the MongoDB Overview dashboard, the charts appear without data. I could not find the error.
Are you sure that it is correctly linked to your database? Do you have any data in this database using a simple database explorer?
Thanks for this. setting the MONGO_URI directly worked for me. How can I monitor multiple running standalone instances of mongo on the same host. Hard trouble setting the MONGO_URI for that. Can one exporter monitor multiple mongos? If so how would I do that?
Thanks for this , my mongo database running as a container pod in kubernetes , we have installed Grafana and Prometheus as a container only using helm , i want install mongo-exporter as a container and i want get metrics in Grafana.
If you have any document related to that can you please share me , it will more helpful for me.
Thanks
the url for the wget is wrong as it downloads the github page and saves it as json not the raw data.
use this:
https://raw.githubusercontent.com/percona/grafana-dashboards/master/dashboards/MongoDB_Overview.json
mongodb_exporter 0.11.0 seems to be the last one that works with atlas srv-s
Thanks Schkn. I have the prometheus running, mongodb exporter running. I’m able to see my mongo servers are up & I can see the metrics on prometheus.
But when I import a dash board to grafana, those metrics are not showing up in grafana. I don’t see any error.
I have prometheus & grafana running on one server and added targets to prometheus.yml for my mongo 3 server replica set.
Should we install the mongodb exporter in all instances in replica set or what’s the major difference in setting up mongodb exporter for replica set. Your answer is greatly appreciated.
if not exporter connect to mongo ;
IV – Common Errors / clue3
set the MongoDB URI directly in the service file