
In today’s tutorial, we are going to take a look at one of the most popular monitoring stacks : Grafana and Prometheus.
Prometheus is a time series database, created in 2012 and part of the Cloud Native Computing Foundation, that exposes dozens of exporters for you to monitor anything.
On the other hand, Grafana is probably one of the most popular monitoring tools.
In Grafana, you create dashboards that bind to datasources (such as Prometheus) in order to visualize your metrics in near real-time.
Grafana & Prometheus natively bind together, so today we are going to see how you can setup Prometheus and Grafana on your Linux system.
This tutorial works for the latest versions of Ubuntu (19.04) and Debian (10 Buster).
Ready?
I – What You Will Learn
By following this tutorial, you are going to learn about the following concepts:
- Installing a Prometheus server on your Linux server.
- How to configure authentication and encryption on Prometheus with a reverse proxy
- How to install and configure Grafana for Prometheus
- How to install your first exporter in Prometheus to monitor Linux system metrics.
- How to import your first monitoring dashboard on Grafana
II – Installing Prometheus on Ubuntu and Debian
First, we are going to see how you can install the latest version of Prometheus and configure it for your Linux server.
a – Download Prometheus
First, head over to the Prometheus downloads page.
Make sure to filter for your operating system and your CPU architecture (in my case Linux and amd64)
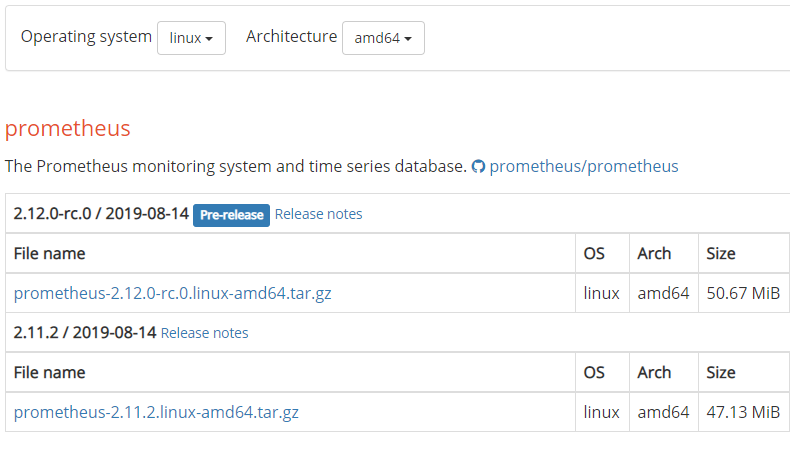
Make sure to select the latest stable version, and not the “rc” one, as it is not considered stable enough for now.
Download the archive on your system by clicking on the archive, or by running a wget command if you are using the Terminal.
$ wget https://github.com/prometheus/prometheus/releases/download/v2.11.2/prometheus-2.11.2.linux-amd64.tar.gzYou should now have the tar.gz file on your system.
Untar it to extract the files in the archive.
$ tar xvzf prometheus-2.11.2.linux-amd64.tar.gz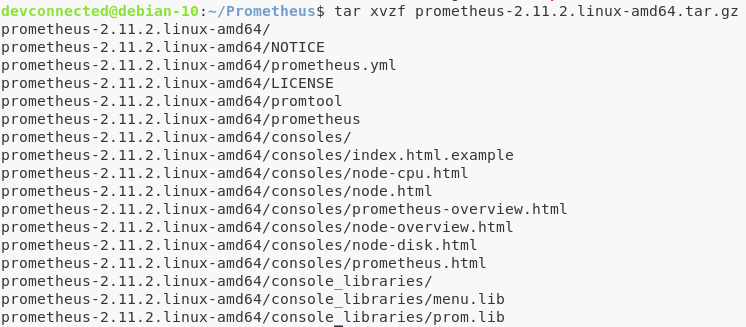
The archive contains many important files, but here is the main ones you need to know.
- prometheus.yml: the configuration file for Prometheus. This is the file that you are going to modify in order to tweak your Prometheus server, for example to change the scraping interval or to configure custom alerts;
- prometheus: the binary for your Prometheus server. This is the command that you are going to execute to launch a Prometheus instance on your Linux box;
- promtool: this is a command that you can run to verify your Prometheus configuration.
We are not going to execute directly the Prometheus, instead we are going to configure it as a service.
It will bring more robustness and reliability in case our Prometheus server were to stop suddenly.
b – Configuring Prometheus as a service
First of all, for security purposes, you are going to create a Prometheus user with a Prometheus group.
$ sudo useradd -rs /bin/false prometheusMake sure to move the binaries to your local bin directory.
I stored my binaries in a Prometheus folder, located on my home directory.
Here’s the command to move them to the bin directory.
$ cd Prometheus/prometheus-2.11.2.linux-amd64/
$ sudo cp prometheus promtool /usr/local/bin
Give permissions to the Prometheus user for the prometheus binary.
$ sudo chown prometheus:prometheus /usr/local/bin/prometheusCreate a folder in the /etc folder for Prometheus and move the console files, console libraries and the prometheus configuration file to this newly created folder.
$ sudo mkdir /etc/prometheus
$ sudo cp -R consoles/ console_libraries/ prometheus.yml /etc/prometheus
Create a data folder at the root directory, with a prometheus folder inside.
$ sudo mkdir -p data/prometheusGive the correct permissions to those folders recursively.
$ sudo chown -R prometheus:prometheus data/prometheus /etc/prometheus/*Great!
You are now set to create a Prometheus service.
Head over to the /lib/systemd/system folder and create a new file named prometheus.service
$ cd /lib/systemd/system
$ sudo touch prometheus.service
In order to see the different launch options for Prometheus, you can run the prometheus command with a h flag.
$ prometheus -h
usage: prometheus [<flags>]

The Prometheus monitoring server

Flags:
  -h, --help                     Show context-sensitive help (also try --help-long and
                                 --help-man).
      --version                  Show application version.
      --config.file="prometheus.yml"
                                 Prometheus configuration file path.
      --web.listen-address="0.0.0.0:9090"
Edit the newly created file, and paste the following content inside.
$ sudo nano prometheus.service

[Unit]
Description=Prometheus
Wants=network-online.target
After=network-online.target

[Service]
Type=simple
User=prometheus
Group=prometheus
ExecStart=/usr/local/bin/prometheus \
  --config.file=/etc/prometheus/prometheus.yml \
  --storage.tsdb.path="/data/prometheus" \
  --web.console.templates=/etc/prometheus/consoles \
  --web.console.libraries=/etc/prometheus/console_libraries \
  --web.listen-address=0.0.0.0:9090 \
  --web.enable-admin-api

Restart=always

[Install]
WantedBy=multi-user.target
Save your file, enable your service at startup, and start your service.
$ sudo systemctl enable prometheus
$ sudo systemctl start prometheus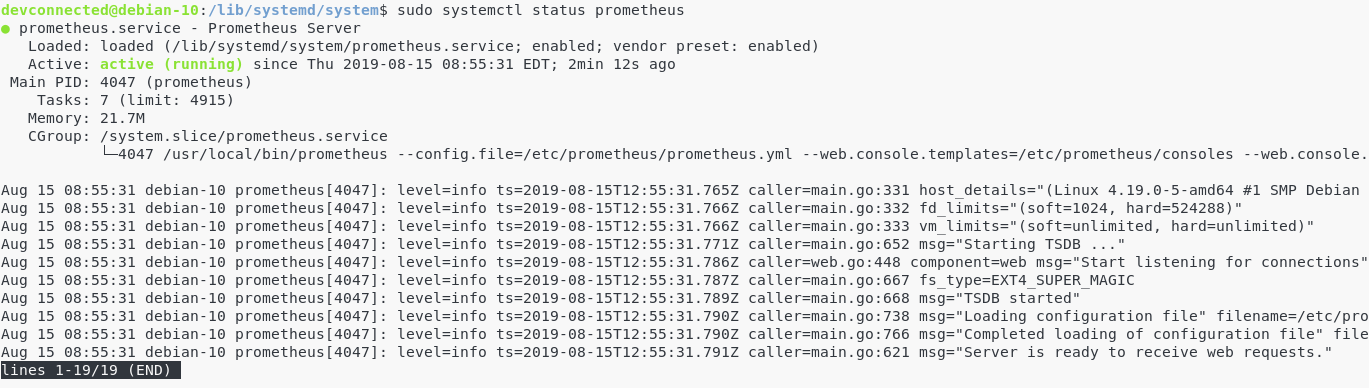
Now that we have our Prometheus server running, let’s connect to the Web UI to make sure that everything is okay.
Unless you modified it in the service file, your Prometheus server should be running at http://localhost:9090.
By default, this is what you should see on your screen.
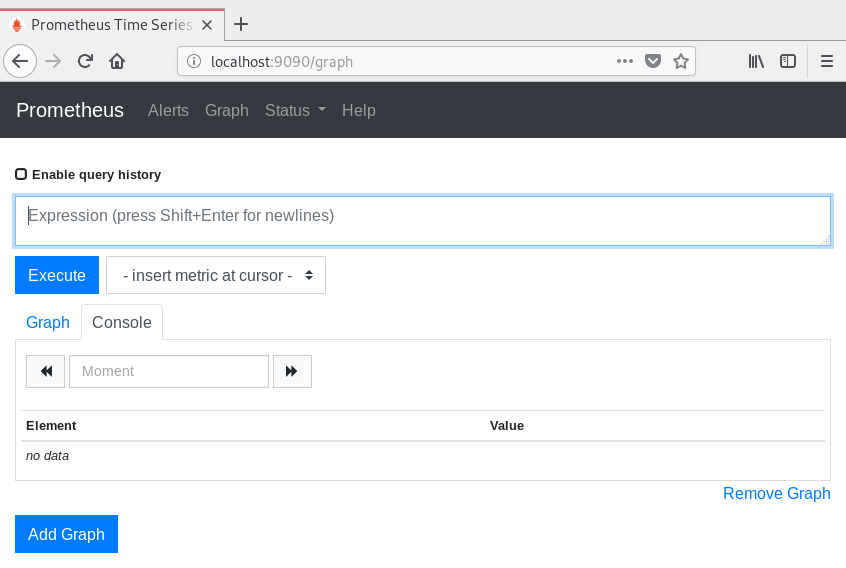
By default, Prometheus should start monitoring itself.
Click on Status, then Targets in top bar menu, and verify that you have one target : the Prometheus server itself.
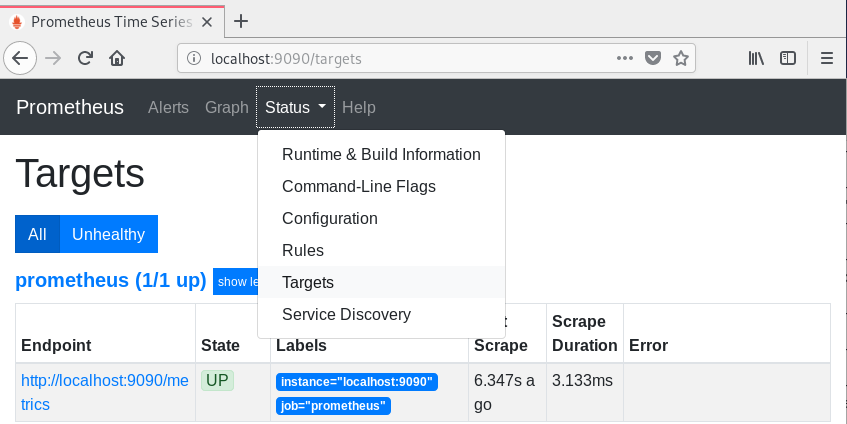
Great! The state is “UP” for the Prometheus target. Everything is running smoothly.
Now that our Prometheus server is running, it is time to configure a reverse proxy for authentication and encryption.
III – Setting up a reverse proxy for Prometheus
Prometheus does not natively support authentication or TLS encryption.
If you are running Prometheus locally, it doesn’t not matter that much.
But if you were to expose Prometheus endpoints to the outside world, you would want to setup a strong authentication for users to check Prometheus.
For this tutorial, I will be using NGINX as a reverse proxy, but there are many other proxies out there that you can choose from.
a – Install NGINX on Debian 10
The steps are pretty much the same for Ubuntu 18.04/19.04.
Simply install nginx by downloading it from the apt sources.
$ sudo apt update
$ sudo apt-get install nginx
This should create a nginx service on your server, and it should be started by default.
$ sudo systemctl status nginx
● nginx.service - A high performance web server and a reverse proxy server
   Loaded: loaded (/lib/systemd/system/nginx.service; enabled; vendor preset: enabled)
   Active: active (running) since Fri 2019-07-05 06:01:12 UTC; 1 months 10 days ago
     Docs: man:nginx(8)
 Main PID: 15792 (nginx)
    Tasks: 3 (limit: 4704)
   CGroup: /system.slice/nginx.service
           ├─15792 nginx: master process /usr/sbin/nginx -g daemon on; master_process on;
By default, NGINX will start listening for HTTP requests in the default http port, which is 80.
If you are not sure about the port used by NGINX, run the following command.
The last column will tell you the port used by NGINX.
$ sudo lsof | grep LISTEN | grep nginx
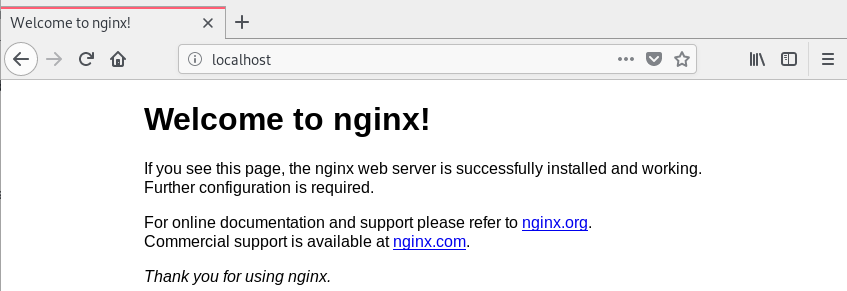
nginx 15792 root 8u IPv4 1140223421 0t0 TCP *:http (LISTEN)Great! Let’s do a quick browser check to see the default HTTP page distributed by NGINX.
b – Configuring NGINX as a reverse proxy
In this case, we are not interested in using NGINX as a standard web server.
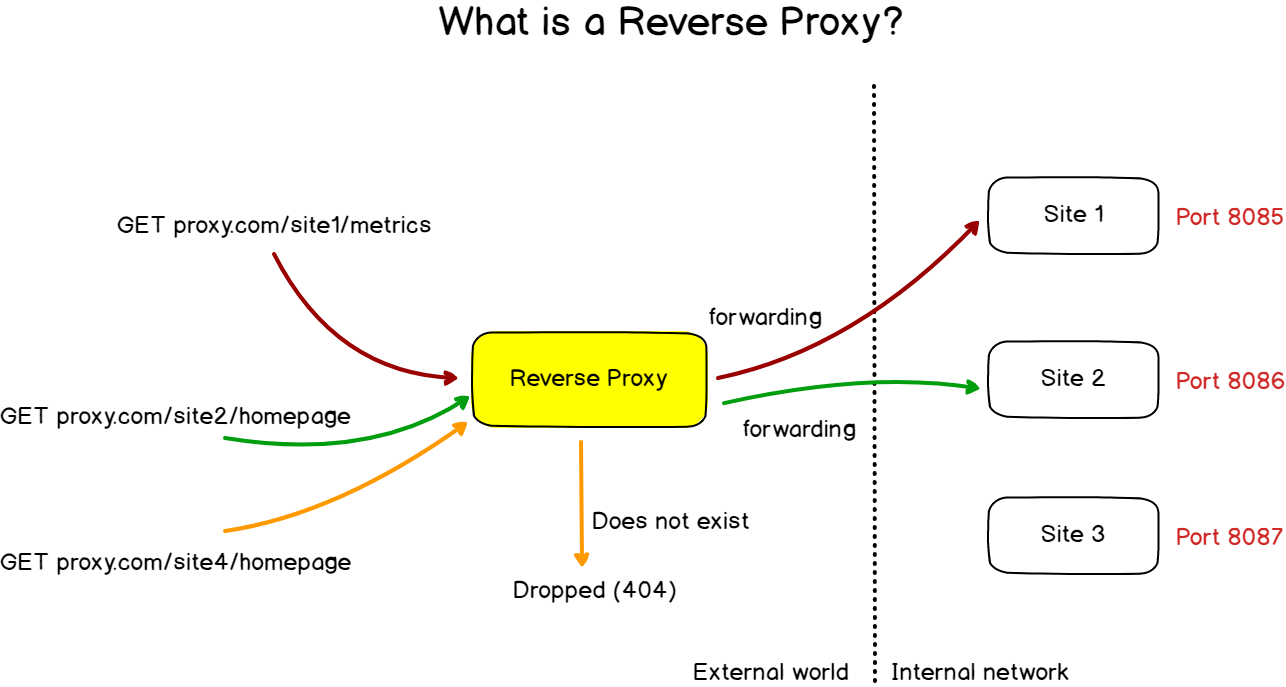
Instead, we want to use NGINX as a reverse proxy.
As a reminder, a reverse proxy is an entity that proxies requests to other entities given a set of internal rules defined in the proxy configuration.
By default, the NGINX configuration file is located at /etc/nginx/nginx.conf.
In this file, you have to make sure that it includes virtual hosts included in the conf.d directory.
$ cat /etc/nginx/nginx.conf

##
# Virtual Host Configs
##

include /etc/nginx/conf.d/*.conf;
include /etc/nginx/sites-enabled/*;
The conf.d directory is where we are going to create our reverse proxy configuration file for Prometheus.
Create a new file in this directory called prometheus.conf, and start editing the file.
$ cd conf.d/
$ sudo touch prometheus.conf
Paste the following configuration in your configuration file.
server {
    listen 1234;

    location / {
      proxy_pass           http://localhost:9090/;
    }
}
Restart your NGINX server, and browse to http://localhost:1234.
$ sudo systemctl restart nginx
(if you have any errors)
$ sudo journalctl -f -u nginx.service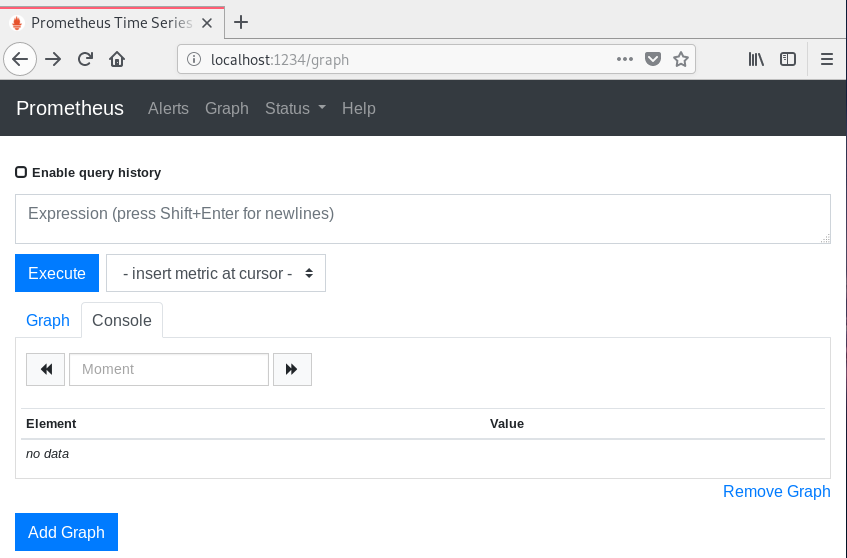
Great!
Prometheus is now sitting behind a reverse proxy.
c – Changing Prometheus configuration for reverse proxying
Now that Prometheus is accessed by a reverse proxy, we need to change the configuration of Prometheus for it to bind to the reverse proxy.
Head over to /lib/systemd/system and change your service configuration file.
$ cd /lib/systemd/system
$ sudo nano prometheus.service

ExecStart=/usr/local/bin/prometheus \
  --config.file=/etc/prometheus/prometheus.yml \
  --storage.tsdb.path="/data/prometheus" \
  --web.console.templates=/etc/prometheus/consoles \
  --web.console.libraries=/etc/prometheus/console_libraries \
  --web.listen-address=0.0.0.0:9090 \
  --web.enable-admin-api \
  --web.external-url=https://localhost:1234
Restart your service, and make sure that your server is up and running correctly.
$ sudo systemctl daemon-reload
$ sudo systemctl restart prometheus
$ journalctl -f -u prometheus.service
Awesome!
Make sure that Prometheus is still reachable at http://localhost:1234.
d – Enable reverse proxy authentication
Before moving on with the reverse proxy, let’s have a quick look at how you can set up credentials for your Prometheus instance.
Prometheus does not handle built-in authentication, so we are going to rely on reverse proxy authentication for this.
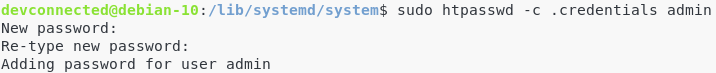
Create a password file in the Prometheus configuration folder.
If you don’t have the htpasswd executable on your system, make sure to install it first.
$ sudo apt-get install apache2-utils
$ cd /etc/prometheus
$ sudo htpasswd -c .credentials admin
Choose a strong password, and make sure that the pass file was correctly created.
Now, it is time to import it into your NGINX configuration file.
Head over to /etc/nginx/conf.d and change your server configuration by adding your credentials.
$ cd /etc/nginx/conf.d

server {
    listen 1234;

    location / {
      auth_basic           "Prometheus";
      auth_basic_user_file /etc/prometheus/.credentials;
      proxy_pass           http://localhost:9090/;
    }
}
Save your file, and restart NGINX
$ sudo systemctl restart nginx
$ journalctl -f -u nginx.service
If everything is okay, go to http://localhost:1234 and you should be prompted with user credentials.
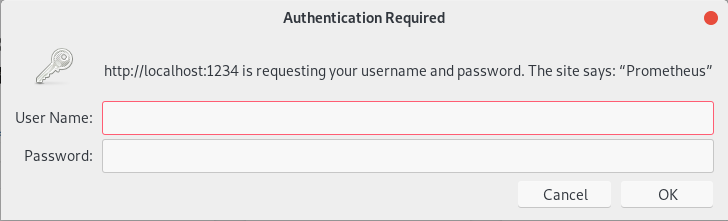
Provide the correct credentials, and you should be good to go!
e – Enabling HTTPS on the reverse proxy
For the last chapter, we are going to enable the TLS protocol on our NGINX instance.
Using HTTPS will encrypt requests done to the server, but most importantly it will encrypt the server responses containing all the metrics.
Creating keys for Prometheus
For this chapter, we are going to use self-signed certificates.
However, if you have a certificate authority, you can issue a certificate request to them.
You will need the certtool in order to create certificates on your Linux instance.
Install the gnutls related packages (utils for Ubuntu and bin for Debian based distributions)
(Ubuntu)
$ sudo apt-get install gnutls-utils

(Debian)
$ sudo apt-get install gnutls-bin
Create a new directory in /etc/ssl in order to store your Prometheus keys.
$ cd /etc/ssl
$ sudo mkdir prometheus
Go into the prometheus directory, and start by generating a private key for Prometheus.
$ sudo certtool --generate-privkey --outfile prometheus-private-key.pemNow that you have a private key, let’s generate a certificate (or a public key) for Prometheus.
$ sudo certtool --generate-self-signed --load-privkey prometheus-private-key.pem --outfile prometheus-cert.pem
  # The certificate will expire in (days): 3650
  # Does the certificate belong to an authority? (Y/N): y
  # Will the certificate be used to sign other certificates? (Y/N): y
  # Will the certificate be used to sign CRLs? (y/N): y
Great!
You now have two keys sitting in your /etc/ssl/prometheus.
Configuring HTTPS on NGINX
Now that our keys are created, it is time to import them into our NGINX configuration.
Go back to your /etc/nginx/conf.d directory, and edit your prometheus.conf file.
$ cd /etc/nginx/conf.d
$ sudo nano prometheus.conf

server {
    listen 1234 ssl;
    ssl_certificate /etc/ssl/prometheus/prometheus-cert.pem;
    ssl_certificate_key /etc/ssl/prometheus/prometheus-private-key.pem;

    location / {
      auth_basic           "Prometheus";
      auth_basic_user_file /etc/prometheus/.credentials;
      proxy_pass           http://localhost:9090/;
    }
}
Again, restart your NGINX server, and your virtual host should now be switched to HTTPS.
$ sudo systemctl restart nginx
$ sudo journalctl -f -u nginx.service
Verify that Prometheus is now delivered via HTTPS
We are going to use cURL in order to verify that Prometheus is now served via HTTPS.
If you don’t own cURL on your instance, make sure to install it first.
$ sudo apt-get update
$ sudo apt-get install curl

$ curl -u admin -k https://localhost:1234/metrics
Enter host password for user admin:
From there, this is what you should see on your screen.
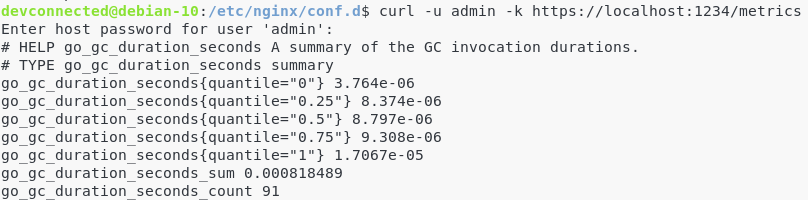
Great! We are now ready to install Grafana to visualize Prometheus metrics.
IV – Installing Grafana
The Grafana installation was already covered extensively in our of our previous articles, so make sure to read it to setup your Grafana server.
a – Configure Prometheus as a Grafana datasource
First, head to the datasources panel by clicking on Configuration > Data sources via the left menu.
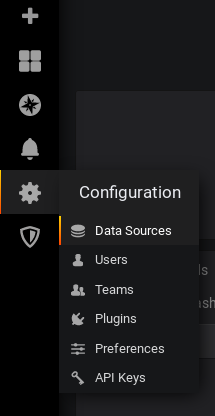
Click on “Add a datasource”
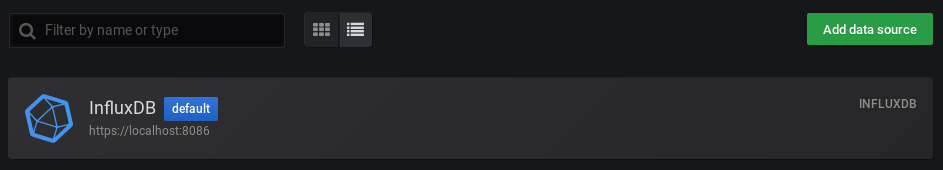
Select a Prometheus data source on the next window.

Here is the configuration for Prometheus. Make sure to skip the TLS verification as you are using a self-signed certificate.
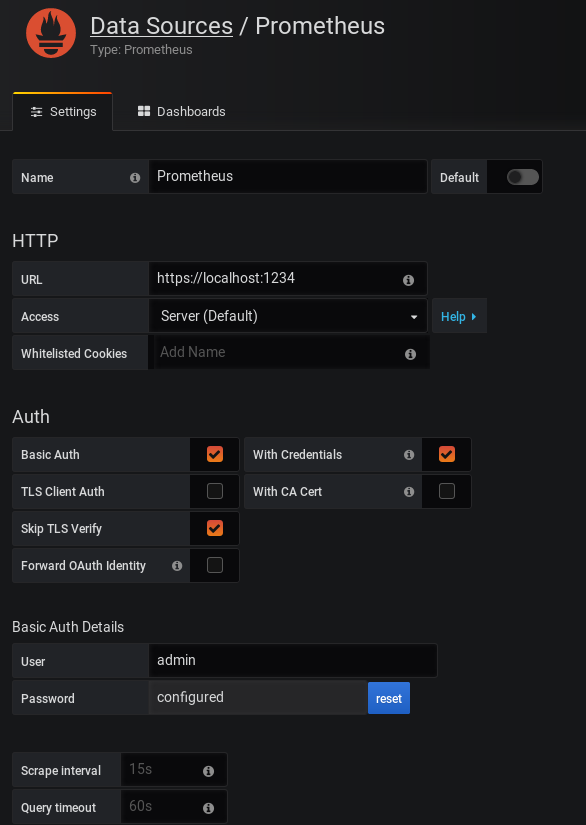
Click on “Save and Test” at the bottom of your configuration window, and make sure that your data source is working properly.

V – Installing the Node Exporter to monitor Linux metrics
Now that your Prometheus data source is working, it is time to install your first exporter.
As a reminder, exporters are standalone entities that regularly aggregate metrics for a wide variety of targets : operating systems, databases, websites..
If you feel like you are missing some of the concepts about Prometheus, here’s a guide to understand them.
The Node Exporter is an exporter that gathers metrics abour your Linux system : the CPU usage, the memory usage as well as various statistics on your filesystems.
a – Downloading the Node Exporter
First of all, we are going to download the Node exporter on our system.
Head over to https://prometheus.io/download/ and select Linux operating systems for amd64 CPU architectures.
Scroll down, and find the section dedicated to the node exporter.
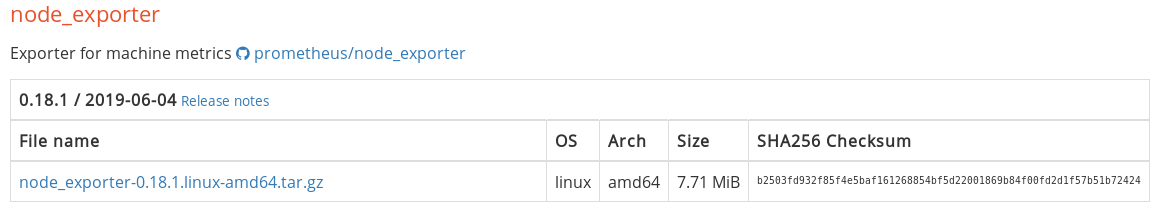
Simply click on it, or copy the link and run a wget command.
$ wget https://github.com/prometheus/node_exporter/releases/download/v0.18.1/node_exporter-0.18.1.linux-amd64.tar.gzExtract the archive to access the files inside it.
$ tar xvzf node_exporter-0.18.1.linux-amd64.tar.gzInside your newly created directory, you should now see the node_exporter binary ready for use.
Again, move this executable to your /usr/local/bin folder.
$ cd node_exporter-0.18.1.linux-amd64/
$ sudo cp node_exporter /usr/local/bin
Create a new user for the node exporter, and change the permissions for the node exporter binary.
$ sudo useradd -rs /bin/false node_exporter
$ sudo chown node_exporter:node_exporter /usr/local/bin/node_exporter
b – Create a Node Exporter service
Again, we are going to run the node exporter as a service.
Go to the /lib/systemd/system folder and create a new file named node_exporter.service
$ cd /lib/systemd/system
$ sudo touch node_exporter.service
Paste the following content in your node exporter service.
By default, a lot of modules (cpu, mem, disk) are already enabled by default, so we only need to enable a few more.
[Unit]
Description=Node Exporter
Wants=network-online.target
After=network-online.target

[Service]
Type=simple
User=node_exporter
Group=node_exporter
ExecStart=/usr/local/bin/node_exporter \
    --collector.mountstats \
    --collector.logind \
    --collector.processes \
    --collector.ntp \
    --collector.systemd \
    --collector.tcpstat \
    --collector.wifi

Restart=always

[Install]
WantedBy=multi-user.target
When you are done, enable your service, and start it.
$ sudo systemctl daemon-reload
$ sudo systemctl enable node_exporter
$ sudo systemctl start node_exporter

(Make sure that everything is running smoothly)
$ sudo journalctl -f -u node_exporter.service
c – Configure the Node Exporter as a Prometheus target
Now that the node exporter is up and running, we need to tell Prometheus to scrape it periodically.
To do that, go to your Prometheus configuration file located at /etc/prometheus/prometheus.yml.
$ cd /etc/prometheus
$ sudo nano prometheus.yml
In the static_configs part of your configuration file, add a new entry for the node exporter.
static_configs:
            - targets: ['localhost:9090', 'localhost:9100']
Restart Prometheus for your changes to be applied.
$ sudo systemctl restart prometheusHead over to https://localhost:1234/targets and make sure that your target is correctly scraped.
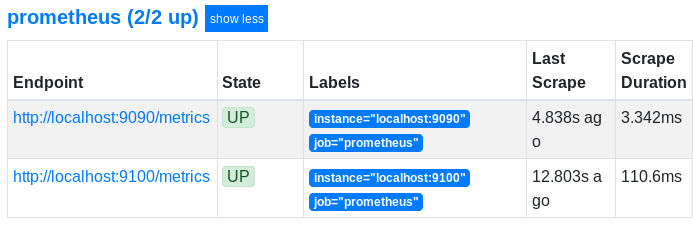
Great! Prometheus is now scraping metrics from the Node Exporter.
VI – Building a Grafana dashboard to monitor Linux metrics
The last step will be to import a Grafana dashboard that reflects the metrics that we are gathering with Prometheus.
The “Node Exporter Full” dashboard created by idealista seems to be a great candidate.
Looking to create your own Grafana dashboard using the UI or the API? Follow the guide!
a – Importing a Prometheus dashboard into Grafana
We don’t have to design the entire dashboard by ourselves, we can import idealista’s dashboard right into our Grafana server.
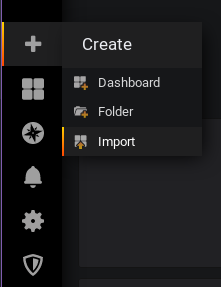
To do so, click on “Import” by hovering the “Plus” icon, and clicking on “Import.
On the next window, simply enter the dashboard ID in the corresponding field (1860 in our case)
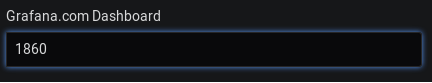
The dashboard should be automatically detected by Grafana.
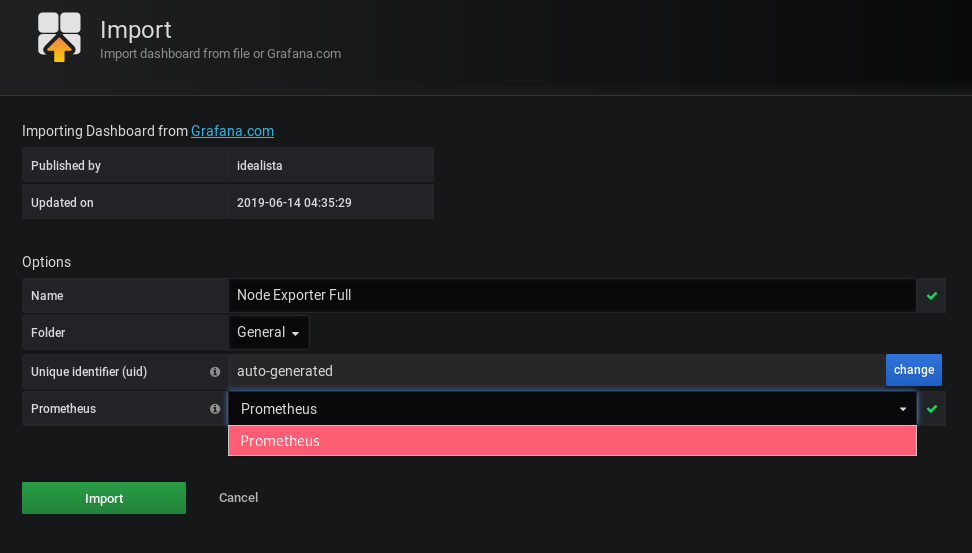
On the next window, select your Prometheus data source, and click on Import.
You are done! Your dashboard is now up and running.
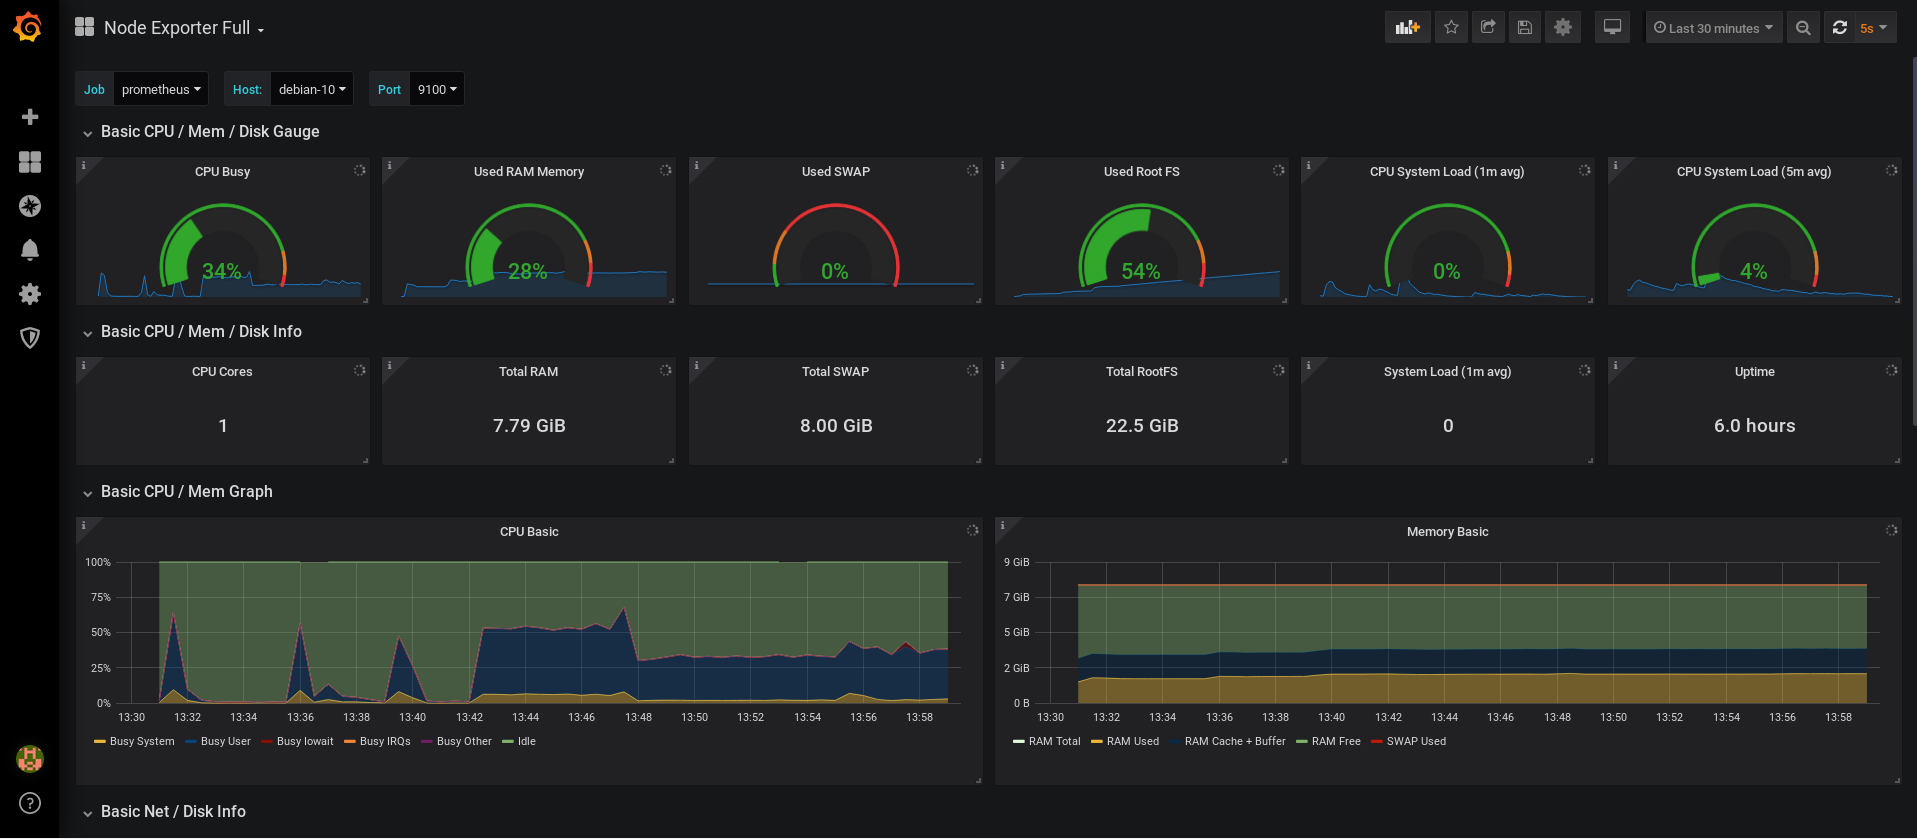
(If you are not seeing metrics right away, make sure to tweak the time parameter located at the top right corner of the dashboard)
So, where should you go from there?
The possibilities are endless.
You can start by adding more exporters to your Prometheus instance.
The full list of Prometheus exporters is available here.
Also, if you are looking for examples for MongoDB and MySQL, I wrote some tutorials about those specific exporters.
If you are looking to continue with the Node exporter, there is a complete guide about it in the monitoring section.
I hope that you learned something new today.
Until then, have fun, as always.
16 comments
[…] complete Prometheus installation for Linux was already covered in one of our previous […]
[…] our previous tutorials, we already discovered how to install Prometheus with Grafana on Linux operating […]
Excellent.
Thank you.
Hi
I have done everything that was written here. But at the end 1860 plugin doesn’t show anything ()(
great guide, it worked at first try without any issue.
A couple questions.
I use a custom SSL cert, but when I remove the “Skip TLS Verify” and put my custom certificate, it fails to connect to the datasource. Otherwise it works very well. However it is communicating internally, isn’t it?
Another thing, I would like to create a grafana.conf file to reverse proxy also the grafana dashboard. Any advice?
Hi,
I am not sure about this step. When you state the following:
Create a data folder at the root directory, with a prometheus folder inside.
$ sudo mkdir -p data/prometheus
Are you referring to the System’s root folder, or Prometheus root folder within my Home folder (the uncompressed file), or perhaps the new folder in /usr/local/bin/ ?
Hi,
Prometheus service failed to start. Any ideas?
———————————
test@prometheussrv:/lib/systemd/system$ sudo systemctl start prometheus
test@prometheussrv:/lib/systemd/system$ sudo systemctl status prometheus
● prometheus.service – Prometheus
Loaded: loaded (/lib/systemd/system/prometheus.service; enabled; vendor preset: enabled)
Active: failed (Result: exit-code) since Thu 2020-02-13 22:03:23 UTC; 1s ago
Process: 2821 ExecStart=/usr/local/bin/prometheus –config.file=/etc/prometheus/prometheus.yml –storage.tsdb.path=/data/prometheus –web.console.templ
Main PID: 2821 (code=exited, status=2)
Feb 13 22:03:23 prometheussrv systemd[1]: prometheus.service: Main process exited, code=exited, status=2/INVALIDARGUMENT
Feb 13 22:03:23 prometheussrv systemd[1]: prometheus.service: Failed with result ‘exit-code’.
Feb 13 22:03:23 prometheussrv systemd[1]: prometheus.service: Service hold-off time over, scheduling restart.
Feb 13 22:03:23 prometheussrv systemd[1]: prometheus.service: Scheduled restart job, restart counter is at 5.
Feb 13 22:03:23 prometheussrv systemd[1]: Stopped Prometheus.
Feb 13 22:03:23 prometheussrv systemd[1]: prometheus.service: Start request repeated too quickly.
Feb 13 22:03:23 prometheussrv systemd[1]: prometheus.service: Failed with result ‘exit-code’.
Feb 13 22:03:23 prometheussrv systemd[1]: Failed to start Prometheus.
————————————–
Thanks
Try the command #journalctl -xe to get the details of the problem. This will shed more light on how to resolve the issue. One culprit is having cockpit running on same server you have prometheus installed will not allow prometheus service to run but yours may not be the case.
Thanks for the useful information!
This command is causing the servicd startup error $ sudo mkdir -p data/prometheus
it should be $ sudo mkdir -p /data/prometheus
so does the next permission command should be /data and just daat
Wow!, a single document containing a lot of information. This is awesome. Well done Schkn
I think you deserve cups of coffee as other authors always request. in case you need one please let me know where to drop my cup of coffee.
Enter the command journalctl -xe to get more details of what issue might be
This command is causing the servicd startup error $ sudo mkdir -p data/prometheus
it should be $ sudo mkdir -p /data/prometheus
so does the next permission command should be /data and just daat
it should be $ sudo chown -R prometheus:prometheus /data/prometheus /etc/prometheus/*
(need to add “/”)
Also got the same error starting prometheus service via systemctl, via journalctl noted that it doesn’t like the double quotes on this parameter:
–storage.tsdb.path=”/data/prometheus” \
so for me, this amendment worked:
–storage.tsdb.path=/data/prometheus \
of the prometheus.service file.
The same – in the status prometheus did`n work.
So I ask and repeated for Manuel –
$ sudo mkdir -p data/prometheus
Where exactly we making this dir?
I can’t find it either under the user or under the root.
Any ideas?