
A version of this tutorial already exists for Ubuntu 18.04.
Released in 2013 by Grafana Labs, Grafana is one of the most fastest-growing monitoring solutions in use in 2019.
Grafana is a dashboarding solution plugging to a wide variety of datasources (most of the time time series databases) in order to visualize data in near real-time.
Used by many big companies such as the CERN, Digital Ocean or Paypal, Grafana is also used in small-to-medium corporations willing to have feedbacks on the health of their infrastructure.
If you are ready to use Grafana for your business or for personal use, this is the right tutorial for you.
Here are all the steps to install Grafana on Windows 8 and 10 :
I – Download the Grafana archive from the official website
For Windows, open your web browser and navigate to the Grafana downloads page.
Select “Windows” on the list of available operating systems, and click on “Download the Installer“.
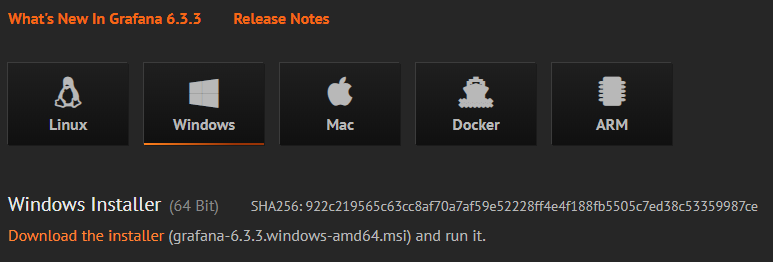
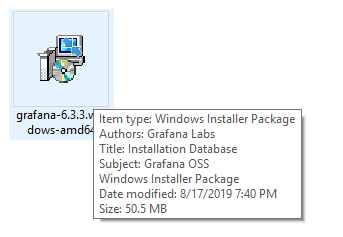
The MSI download should begin.
When you are done, simply execute the MSI installer.
II – Install Grafana on Windows
When running the MSI, this is what you should see.
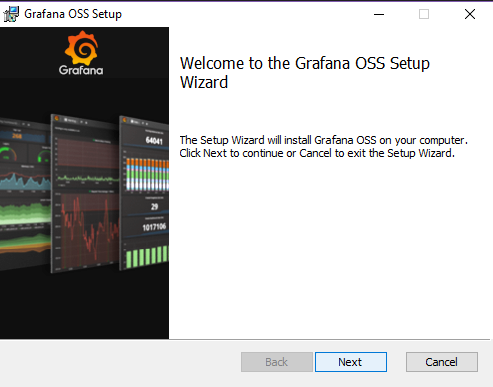
Click on “Next“.
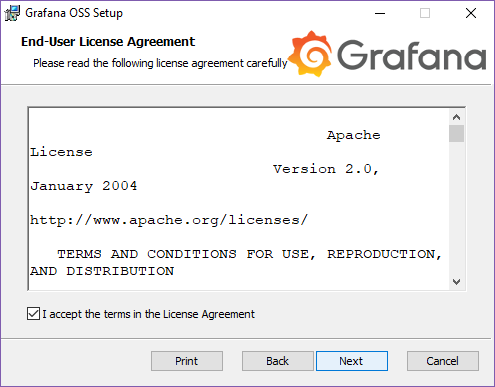
Accept the terms of the license agreement and click on “Next“.
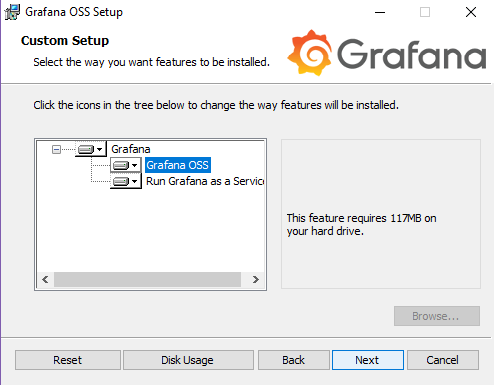
Make sure that the Grafana OSS (the Grafana server) and the Grafana as a Service option are correctly selected.
If this is the case, click on “Next” and on “Install“
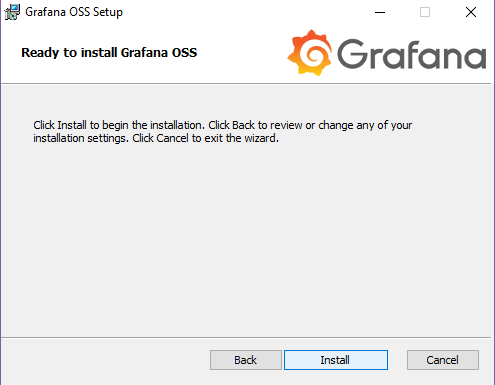
At this point, the Grafana installation should begin.
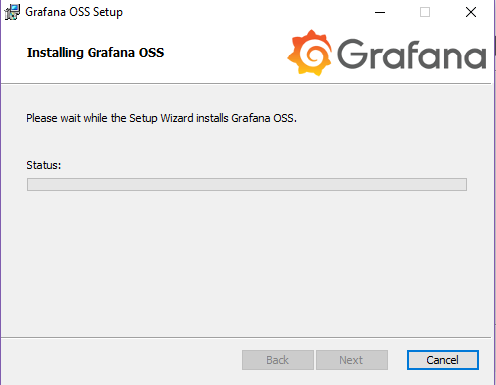
If at some point, you are prompted with a firewall exception, make sure to authorize Grafana to perform changes to your system.
When the installation is done, this is the screen that you should see.
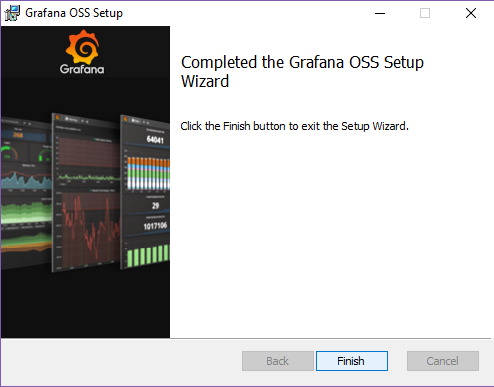
Awesome! You just installed Grafana on Windows.
III – Verify that your Grafana service is running
Before going any further, you have to verify that your Grafana server is correctly running as a Windows service.
In many cases, Grafana’s default port (3000) might be already taken, preventing Grafana to start correctly.
As a consequence, here’s how you can verify that it is running.
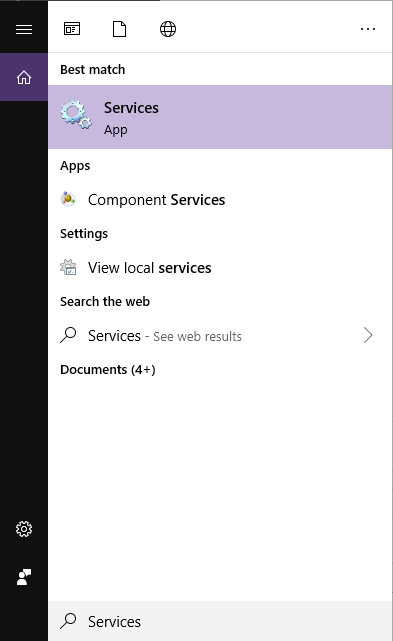
In Windows search menu, type “Services” and open the Services window.
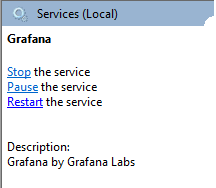
In the Services window, scroll until you reach the Grafana service.
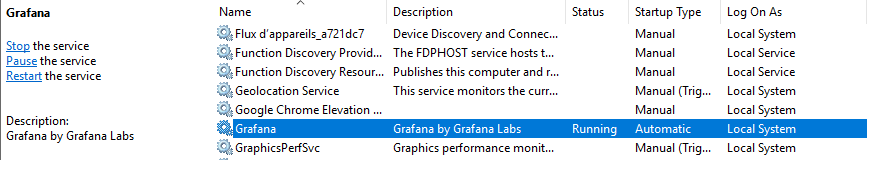
Great! The Grafana service is up and running.
IV – Launch Grafana v6 Web UI
If the service is running properly, you should be able to access the Grafana v6 UI.
As a reminder, Grafana runs by default on the port 3000.
As a consequence, open a web browser and navigate to http://localhost:3000.
This is the screen that you should see.
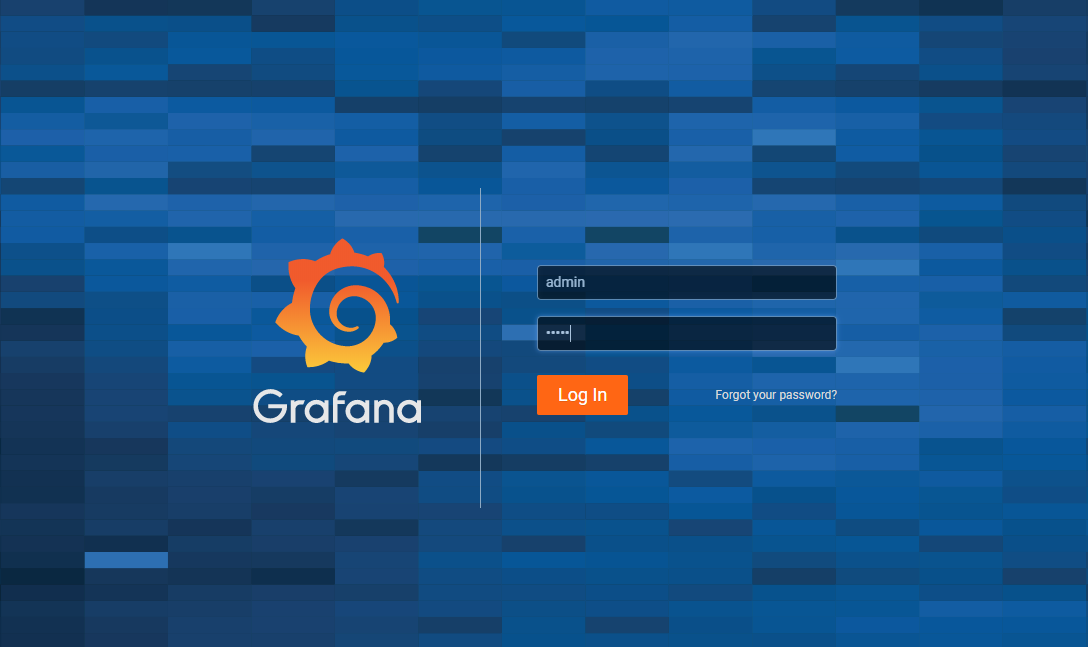
On Grafana, the default credentials are admin (as a username) and admin (as a password) by default.
On the next window, you will be asked to change your password. Choose a strong password to prevent security breaches.
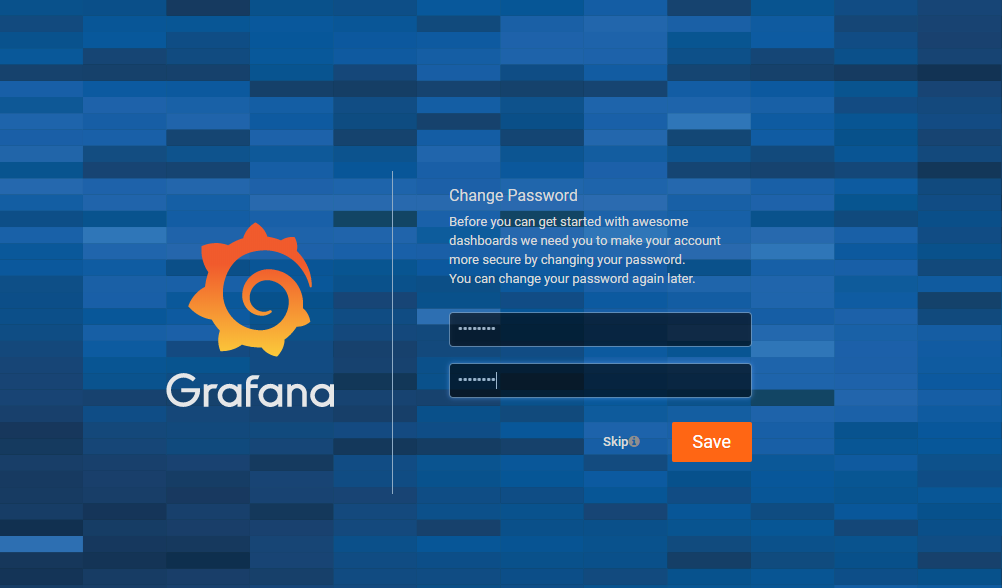
When you are done, click on “Save“.
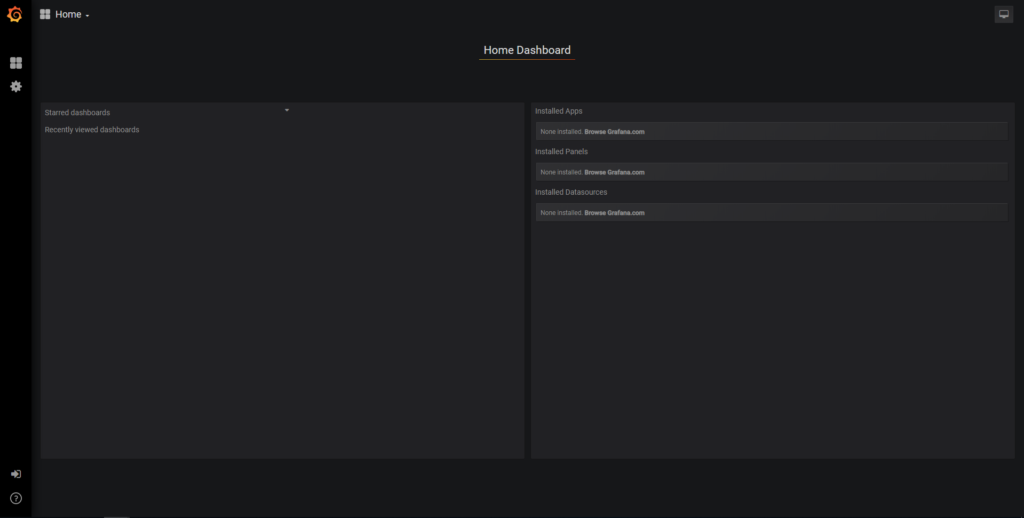
Great! You should now see the default screen for Grafana v6.3 on Windows.
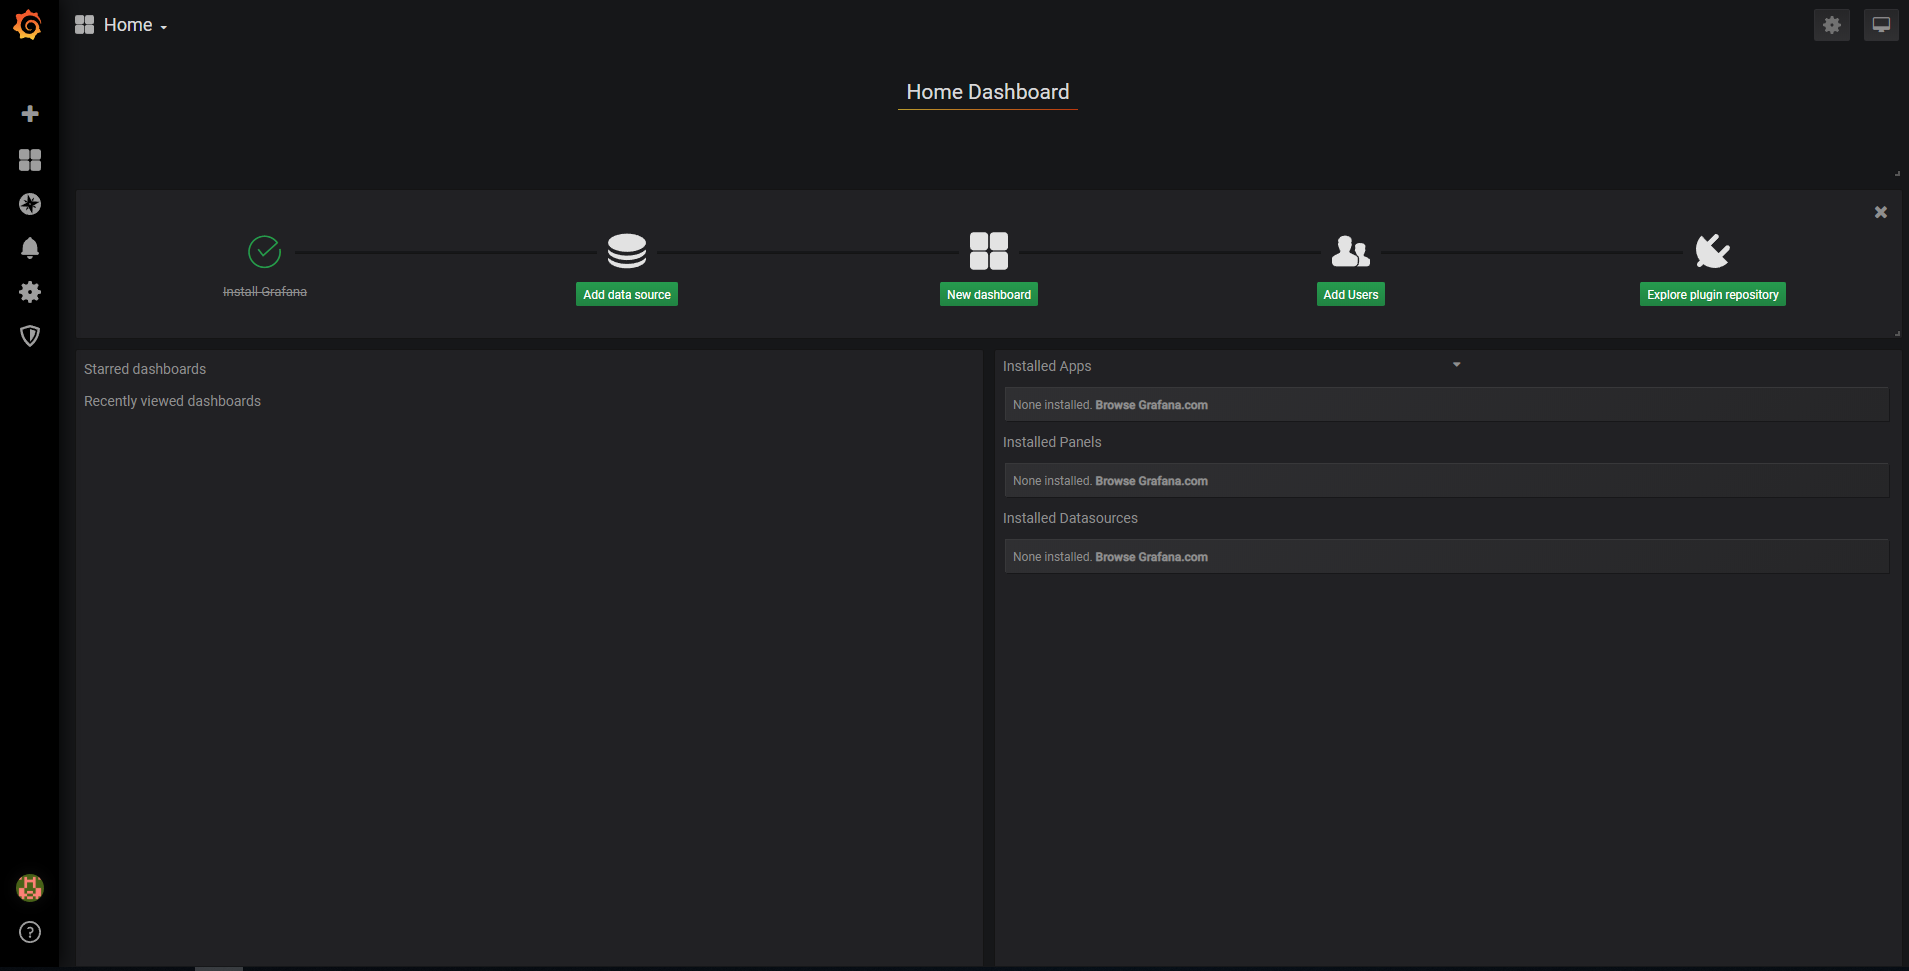
Before creating your own dashboards, there are some configuration steps that you need to perform for a new instance.
V – Define your own configuration file
In the latest Grafana distributions for Windows, the service is launched by NSSM (which is a service manager for Windows).
By default, Grafana relies on configuration files located in the conf folder of your installation directory.
Mine is located at C:\Program Files\GrafanaLabs\grafana as an example.
This is the content of the conf folder.
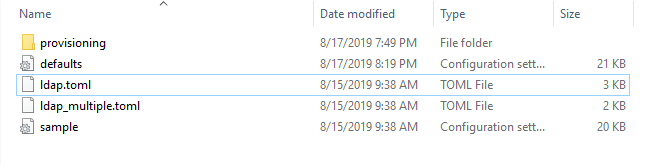
By default, Grafana is going to use the content of the defaults.ini file, but we are going to overwrite that to have our own custom configuration file.
In case we are having some trouble with our own configuration file, we can go back to the defaults file easily.
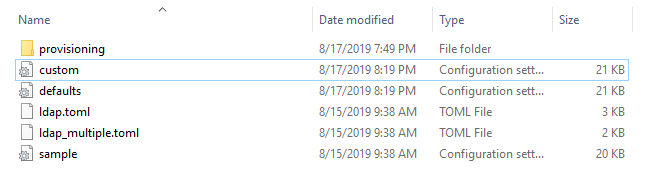
Make a copy of the defaults file, and name it “custom.ini“
When running the installation MSI, Grafana is going to store a NSSM executable on the GrafanaLabs folder of your installation folder.
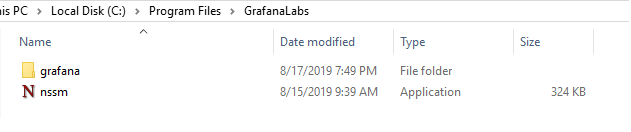
Open a Powershell instance on your computer as an administrator, and navigate to this folder.
Do not forget the quotes around the path, otherwise you will get a Powershell exception.
$ cd "C:\Program Files\GrafanaLabs"
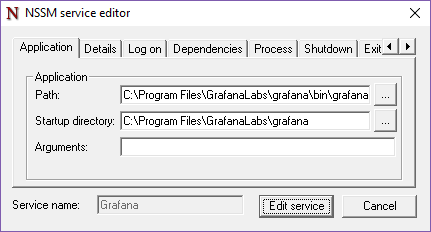
$ .\nssm.exe edit grafanaA window similar to this one should open.
At the end of the path variable, add a –config flag with the name of the configuration file we just created.
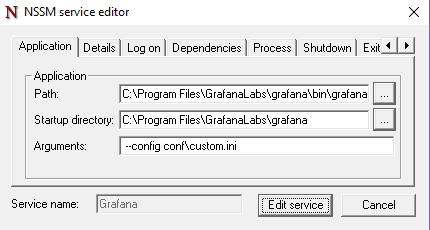
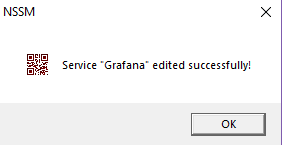
Arguments: --config conf\custom.iniClick on “Edit Service” and you should be prompted with a success message.
Restart your service, and make sure that Grafana is still running correctly (http://localhost:3000)
VI – Enable / Disable sign-up on Grafana
By default, the account creation is located at http://localhost:3000/signup on your Grafana instance.
On Grafana v6.3, account sign up is disabled by default.
However, you may want to enable this option on your Grafana server, if you authorize guests to have an account to showcase some special dashboards.
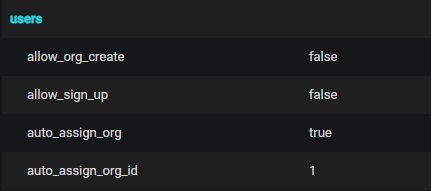
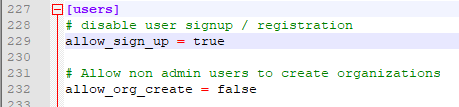
To enable sign-up, head to your custom.ini configuration file (located on the conf folder), and navigate to the [users] section of the file.
Modify the allow_sign_up entry to true.
To verify that everything is working properly, go to http://localhost:3000/signup and try to create an account.
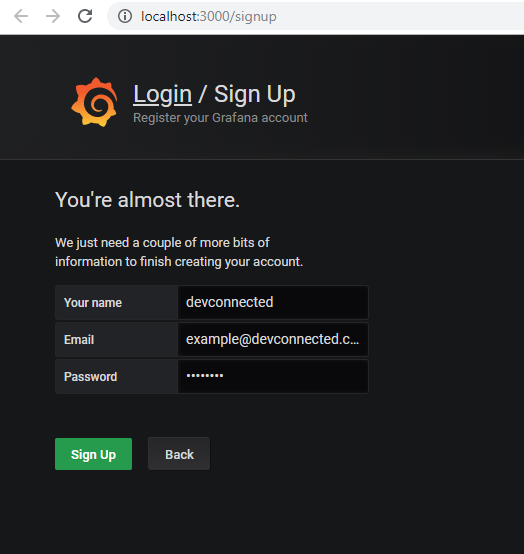
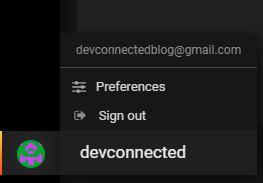
Click on “Sign Up” and you should be redirected to the main page.
Awesome! Your account has been created!
VII – Enable / Disable Anonymous Access
By default, anonymous access is disabled on Grafana.
Anonymous access means that any unauthenticated user is able to browse your Grafana instance, at least for the default organization assigned to them.
If you go http://localhost:3000, you are going to be redirected to the login screen if you are an anonymous user.
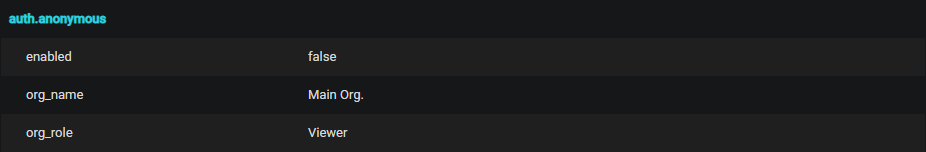
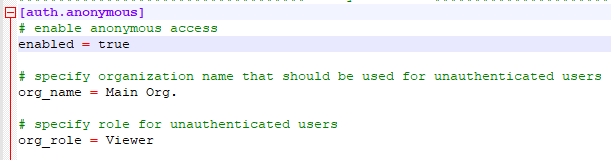
To change that, edit your custom.ini configuration file, and edit the [auth.anonymous] section.
Restart your Grafana service, and browse http://localhost:3000 as an anonymous user (in private mode for example).
You should now have a Viewer permission for the dashboards allowed.
VIII – Conclusion
Today, you learned how to install Grafana on a Windows server.
Now that everything is set up, it is time for you to start monitoring your servers, your instances or your databases.
Here is a selection of articles that you should read to improve with Grafana :
- Install your first datasource for Grafana : How To Install InfluxDB on Windows 8/10
- Configure your first datasource for Grafana : Grafana, InfluxDB and Telegraf setup
- Real world use case : Monitoring Windows Services with Telegraf, InfluxDB and Grafana
Until then, have fun, as always.
11 comments
[…] SSL Certificate Expiration with Grafana AlertManager and Prometheus Complete Setup on Linux How To Install Grafana on Windows 8/10 How To Add a User to Sudoers On… How to Setup Grafana and Prometheus on Linux Understanding […]
Hey, I’m a supernoob to programming in general. In the powershell, should my input be strictly {$ cd “C:\Program Files\GrafanaLabs”
$ .\nssm.exe edit grafana}?
What should that look like?
Hello, I mean to say “Do not forget the quotations marks” in the tutorial, not the “brackets”, I fixed it!
You should execute
$ cd “C:\Program Files\GrafanaLabs”
$ .\nssm.exe edit grafana
Hello,
Installation correct on a windows 7 machine. Using Firefox, Grafana is unreadable, impossible to use the web ui: html problem ?
What’s happening on your browser? Can you reach the Grafana Web UI, or the default home page?
Yes I can reach the grafana web ui but the page is not well formatted: it’s typical a problem of html or css
Note that I tried the exe and the msi, on windows 7 and on windows server 2012, with port 3000 and 8080
Yes I can reach the Grafana web UI. But the page is not well formatted: all information in column. It’s typical an html or css problem.
Note that I tried on windows 7, windows server 2012, with ports 3000 and 8080, the exe and the msi versions.
What web browser are you using to launch Grafana?
test
?
may i know how to connect grafana to elasticsearch in on premises