The rise of the machines has arrived. While you’re reading this article, thousands if not hundreds of thousands of cyberattacks are performed. Some of them are more sophisticated than others : from trojans, phishing attempts, malware infections to botnets attacks (also known as DDoS), cyberattacks are literally everywhere.
Today we are taking a look at a very specific type of attacks : SSH brute-force attacks. We will eventually design a tool that tracks, monitors and locates attackers, in real-time.
I — What is SSH?
Before jumping into architectural concerns and coding, I believe it is important for everybody to be on the same page regarding SSH. (if you already know what SSH is, skip to the next section).
SSH (that stands for Secure Shell) is a secure communication protocol. It allows computer to talk to each other, using a secure tunnel that nobody else can understand. SSH comes as an evolution of the Telnet Protocol, that also provides a communication layer, but unsecure.
SSH is very widely used to access distant remote machines and handle some administration tasks on them.
Note : if we were to connect to our machines using Telnet, the entire world could see our password, and it would be as easy as opening Wireshark and capturing Telnet packets. Say bye to your VMs.
How is it built?
Well.. like HTTPS, SSH is built on common cryptographic techniques: symmetrical encryption or asymmetrical encryption for the most part. Those two techniques are in a way verifying the identity of the two hosts. If I am the client, am I talking to the server that I tried to reach to the first place, or is it a smart kid in between wanting my Facebook credentials?
As a second step, you are asked to provide SSH credentials for the authentication. If those two steps (cryptographic verifications + authentication) are valid, you are logged in.
Now if your server, or computer, or router is connected to the Internet, it is very likely that it is receiving a bunch of cyberattacks everyday without you even noticing it.
Luckily, most of the attacks are not making it and are blocked by either firewalls or anti-malware solutions that may directly be built-in in your computer or in your router. But trust me, if you own a virtual machine in the cloud, somebody right now may try to access it, using a SSH brute force attack, to turn it into a botnet or to steal your personal information.
Today, we will put an end to that.
We will monitor, track and geolocates SSH brute-force attacks that are happening right now on your machine.
II — Capturing SSH attacks logs
Before directly jumping into our architecture and design, how can we manually track SSH brute-force entries that are running on our machine?
For this article, I am using an Ubuntu 18.04 machine using rsyslog for logging tracking. For those who are not very familiar with Linux systems, rsyslog is a tool used on Linux distributions to record, standardize, transform and store logs on an aggregated tool (Logstash for example!).
SSH entries belong to the auth section of rsyslog, that is aggregated in var/log/auth.log .
So how does it look like? Here’s a screenshot from my own Ubuntu logs showing SSH brute-force attempts. Performing a simple less /var/log/auth.log | grep ssh will show you brute force attacks that might happen on your machine as well.

SSH Brute Force Attempts on my machine
See the Failed password for invalid user ubntlines? That’s someone trying to access my machine with invalid credentials. And they are doing it a lot, dozens of attempts per day minimum. Right next to it sits their IP address along with the port that was allocated by SSH for the connection attempt.
Now that we have a way to capture SSH attempts, let’s build a system that can track them in realtime and show them in a realtime worldmap.
III — Architecture & Design
To monitor script kiddies, we are going to use this architecture :
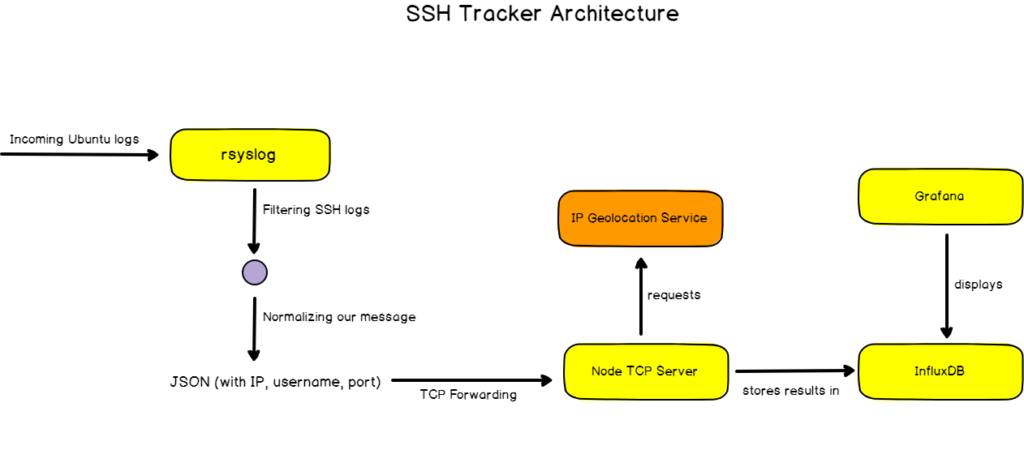
Let’s explain every single part of our application.
First, we need to track rsyslog logs and filter SSH specific logs. Right before TCP forwarding our message, we need to normalize our message to a common format (Normalizer pattern.. anyone?) , I chose JSON for this.
Our message is then processed by a TCP Server listening for incoming logs. For convenience, I chose to use Node for this, but you can use any technology that you find suitable for this. The message is parsed, and the IP is sent to an IP geolocation service (IPStack in this case) that will provide us with a latitude and longitude among other things.
This record is then processed into InfluxDB, and displayed into Grafana for realtime monitoring. Quite simple isn’t it?
a — Filtering rsyslog messages
Before doing anything, we need to be able to filter incoming Ubuntu logs and target the one we are interested in : SSH logs and more precisely ssd service logs. For convenience, I chose to select messages starting with Failed as they are the one containing most of the information regarding the origin of the attack.

To perform this, one needs to head to /etc/rsyslog.d/50-default.conf which contains the standard configuration file for rsyslog. If you are not familiar with this file, this is where you configure where your logs are stored on your Linux system.
At the top of it, we are going to add some beautiful RainerScript that filters sshd messages. (Note : do not forget the stop instruction, otherwise they will also be stored in your default auth locations)
#  Default rules for rsyslog.
#
#                       For more information see rsyslog.conf(5) and /etc/rsyslog.conf

#
# First some standard log files.  Log by facility.
#
if $programname == 'sshd' then {
   if $msg startswith ' Failed' then {
      // Transform and forward data!
   }
   stop
}

auth,authpriv.*                 /var/log/auth.log
*.*;auth,authpriv.none          -/var/log/syslog
#cron.*                         /var/log/cron.log
#daemon.*                       -/var/log/daemon.log
kern.*                          -/var/log/kern.log
#lpr.*                          -/var/log/lpr.log
mail.*                          -/var/log/mail.log
#user.*                         -/var/log/user.log
b — Normalizing our data
Now that our sshd messages are filtered and passed to our pipe, we need a way to normalize them. We will use templates for that. Templates are built-in tools for rsyslog that are used to transform an incoming message to a user defined template.
For our project, we will filter relevant information in the log message and build a JSON out of it.

Relevant information we need to extract
In the /etc/rsyslog.d/ folder, let’s create a file called 01-basic-ip.conf that will host our template. To extract relevant information from the log, I will use a regex in a string template file.
The regex has to match messages starting with Failed and has three capturing groups : one for the username, one for the IP and one for the port. In regex language, it looks like this :
^ Failed.*user([a-zA-Z]*).*([0-9][0-9]*[0-9]*.[0-9][0-9]*[0-9]*.[0-9][0-9]*[0-9]*.[0-9][0-9]*[0-9]*).* port ([0-9]*)
Now that we have our regex, let’s encapsulate it into a JSON object using the string template. The final file looks like this.
template(name="ip-json" type="string" string="{\"username\":\"%msg:R,ERE,1,DFLT:^ Failed.*user ([a-zA-Z]*).* ([0-9][0-9]*[0-9]*.[0-9][0-9]*[0-9]*.[0-9][0-9]*[0-9]*.[0-9][0-9]*[0-9]*).* port ([0-9]*)--end%\",\"ip\":\"%msg:R,ERE,2,DFLT:^ Failed.*user ([a-zA-Z]*).* ([0-9][0-9]*[0-9]*.[0-9][0-9]*[0-9]*.[0-9][0-9]*[0-9]*.[0-9][0-9]*[0-9]*).* port ([0-9]*)--end%\",\"port\":\"%msg:R,ERE,3,DFLT:^ Failed.*user ([a-zA-Z]*).* ([0-9][0-9]*[0-9]*.[0-9][0-9]*[0-9]*.[0-9][0-9]*[0-9]*.[0-9][0-9]*[0-9]*).* port ([0-9]*)--end%\"}")c — Forwarding our message
rsyslog offers a wide panel of output modules for you to forward your logs. One of them is just native TCP forwarding, called omfwd. This is the directive we are going to use to forward our formatted message. Back to our 50-default-conf file.
if $programname == 'sshd' then {
   if $msg startswith ' Failed' then {
     action(type="omfwd" target="127.0.0.1" port="7070" protocol="tcp" template="ip-json")
   }
   stop
}
In this case, our JSON will be forwarded to a TCP host listening on localhost port 7070 (the address of our Node server!).
Nice, we have our rsyslog pipeline.
d — Building a TCP Server
Now, let’s head over to our TCP Server. The TCP server is the recipient for our JSON messages. For convenience with using JSON, I chose Node as a runtime. So what’s the role of our TCP server? Listen to incoming messages, query an external service to retrieve the geolocation of our new friend, and store the whole package to InfluxDB. I won’t keep the suspense running any longer, here’s the code for our server.
var geohash = require("ngeohash");
const config = require("./config");
const axios = require("axios");
const Influx = require("influx");

// TCP handles
const net = require('net');
const port = 7070;
const host = '127.0.0.1';

const server = net.createServer();
server.listen(port, host, () => {
    console.log('TCP Server is running on port ' + port + '.');
});

// InfluxDB Initialization.
const influx = new Influx.InfluxDB({
    host: config.influxHost,
    database: config.influxDatabase
});

let sockets = [];


server.on('connection', function(sock) {
    console.log('CONNECTED: ' + sock.remoteAddress + ':' + sock.remotePort);
    sockets.push(sock);

    sock.on('data', function(data) {
        //console.log(data);
        let message = JSON.parse("" + data)
        // API Initialization.
        const instance = axios.create({
            baseURL: "http://api.ipstack.com"
        });
        instance
            .get(`/${message.ip}?access_key=${config.apikey}`)
            .then(function(response) {
                const apiResponse = response.data;
                influx.writePoints(
                    [{
                        measurement: "geossh",
                        fields: {
                            value: 1
                        },
                        tags: {
                            geohash: geohash.encode(apiResponse.latitude, apiResponse.longitude),
                            username: message.username,
                            port: message.port,
                            ip: message.ip
                        }
                    }]
                );
                console.log("Intruder added")
            })
            .catch(function(error) {
                console.log(error);
            });
    });

    // Add a 'close' event handler to this instance of socket
    sock.on('close', function(data) {
        let index = sockets.findIndex(function(o) {
            return o.remoteAddress === sock.remoteAddress && o.remotePort === sock.remotePort;
        })
        if (index !== -1) sockets.splice(index, 1);
        console.log('CLOSED: ' + sock.remoteAddress + ' ' + sock.remotePort);
    });
});
One side note to this code : latitude and longitude are encoded into something called geohashes which is a way to encode a latitude longitude pair and is used by the Grafana plugin to draw a point. For the final touch, let’s encapsulate this code into a systemd service and launch it.
We’re done for coding!
IV — The All Mighty Visualization
If you have read so far, here’s the good news : the fun part is coming. Now that we are storing our live data in InfluxDB, let’s bind Grafana to it and visualize it.
As a recap, our InfluxDB measurement looks like this :
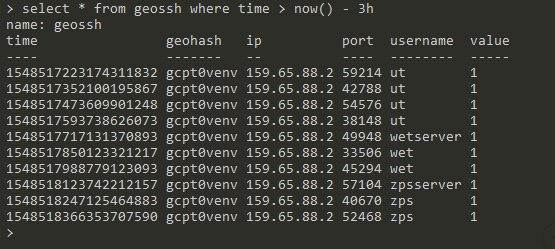
InfluxDB measurement structure
To track our geohashes on a realtime map, we are going to use the plugin WorldMap Panel from Grafana Labs.

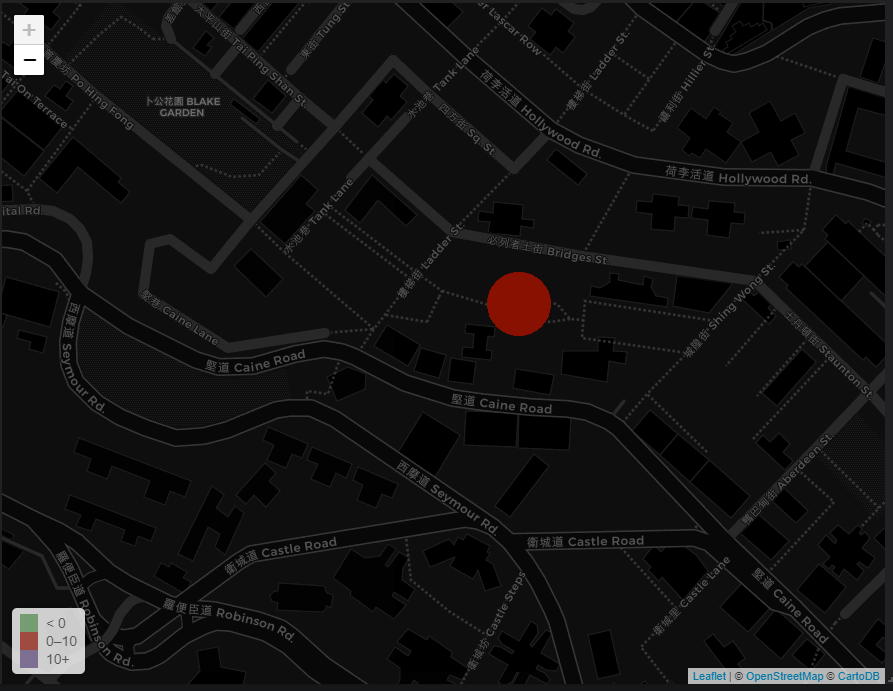
Every single value occurrence in our measurement is going to be a circle on the map. Of course, the circles get bigger if we have more occurrences of certain IPs on our machine. Without waiting more, here’s the map!
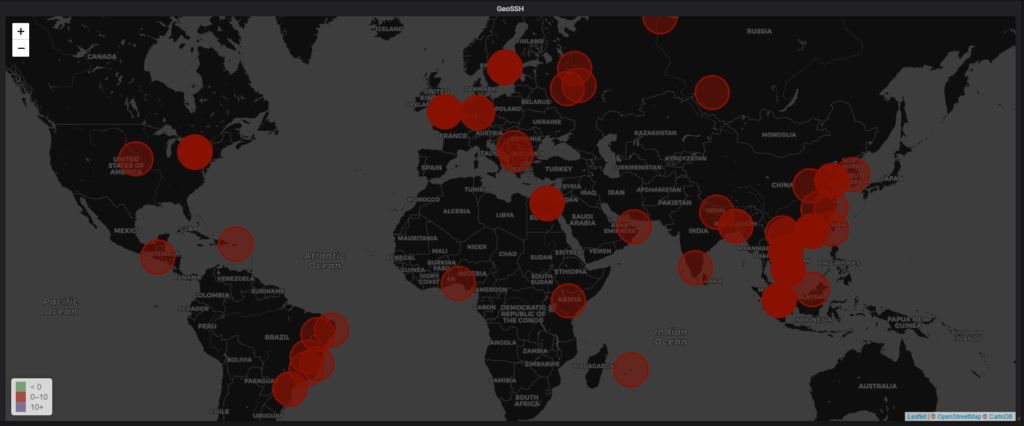
💖 From China with Love. 💖
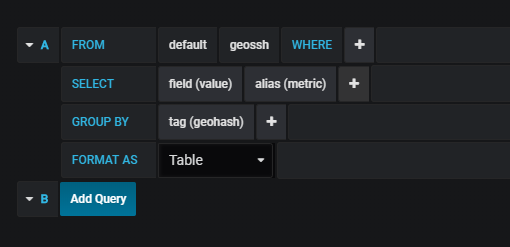
Grafana configuration for the realtime map
Here we have it!
All the locations trying to brute-force my machine. We can very precise by zooming on the map, and see exactly where the attack was coming from!
V — Fun Facts
Over a period of 6 days, my machine was attacked 1660 times. That’s around 270 attacks a day on average. Here’s everything that was attempted as a login.

A very special mention to the ‘wetserver’ attempt. I know that it is a Digital Ocean 🐠 one, but still.. ‘Superman’, nice try, but I am not that megalomaniac when it comes to choosing my user credentials..
Out of those 1660 attacks, around 750 were performed from a single IP address located in Buffalo, in the NY region. The second most SSH spammer comes from.. Stockholm, in Sweden.
For the rest of the attacks, they mainly come from Japan, China, Hong Kong, South Korea, and even Brazil, Great Britain and even Egypt.
VI — A Brief Conclusion
I had a lot of fun designing and implementing this side-project. On a serious note, it shows that nobody is safe from those attacks and I hope that it can bring a bit of awareness on SSH brute-force attacks. When time won’t be that much of a scarse resource, I will write an article about how to secure your machine and prevent those attacks entirely.
Be very careful when it comes to SSH, its maintenance and administration is a key factor in any system. The NSA won’t disagree with this statement.
https://www.venafi.com/blog/deciphering-how-edward-snowden-breached-the-nsa
Until then, have fun with this little experiment. And as always, if you like my work, clap, comment and share this article. It always helps.
Thank you for your time.
Kindly.


6 comments
[…] to Integration Patterns 5 Proven Ways To Finish Your Side Project SQL is Dead, Hail to Flux Geolocating SSH Hackers In Real-Time Monitoring systemd services in realtime with Chronograf Home Guide The Definitive Guide […]
What does the config file for the TCP server look like?
[…] Geolocating SSH hackers in real time with Grafana and InfluxDB […]
[…] If you need more practical tutorials, here’s how you can monitor SSH hackers on a Linux server using InfluxDB. […]
[…] we already saw in the past, SSH attacks are pretty common but they can be avoided if we change default settings […]
Do you have any tutorial how to set up node? This part is missing. Too much information about ssh in the beginning. Most of us already know what it is. I wish I could know hot did you set up node, which databases did you use and how did you set it up? Is it possible to use InfluxDB and Telegraf to monitor this through Grafana? I wish I could have much more detailed configuration described step by step, instead not much informative article. What if I use ipset and have all IP addresses refused and there is no failed login? How the regex should looks like? I wish I could see the geolocation for refused (dropped) connection which are checked by fail2ban ,logged into the the log. I know how to extract IP addresses from fail2ban log, however I wish I could know how to put them into the database like InfluxDB to let Grafana read it and properly translate to proper records. One more question is why did you use MongoDB when you already have the InfluxDB. I do not understand why do you require one more additional non-relation database like MongoDB.