
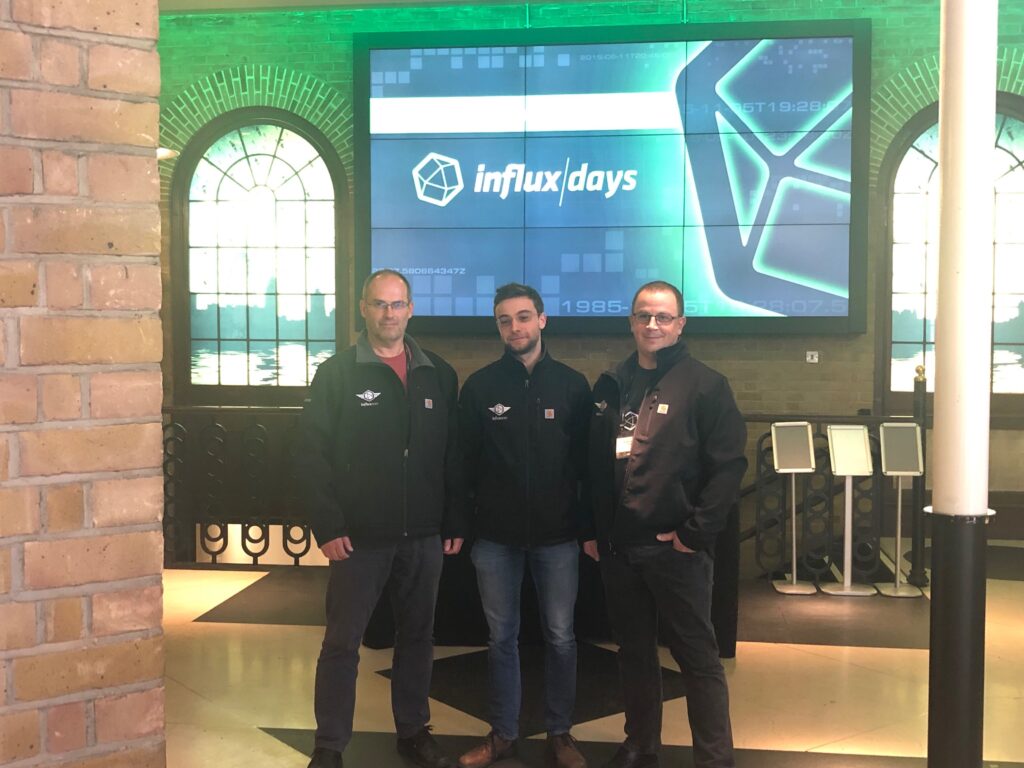
On 13th and 14th of June 2019, I attended InfluxDays London, an annual convention held by InfluxData.
The InfluxDays give insights about the recent developments of the company and the industry in general.
It also features numerous guest speakers who provide feedbacks about real world use cases and reality checks.
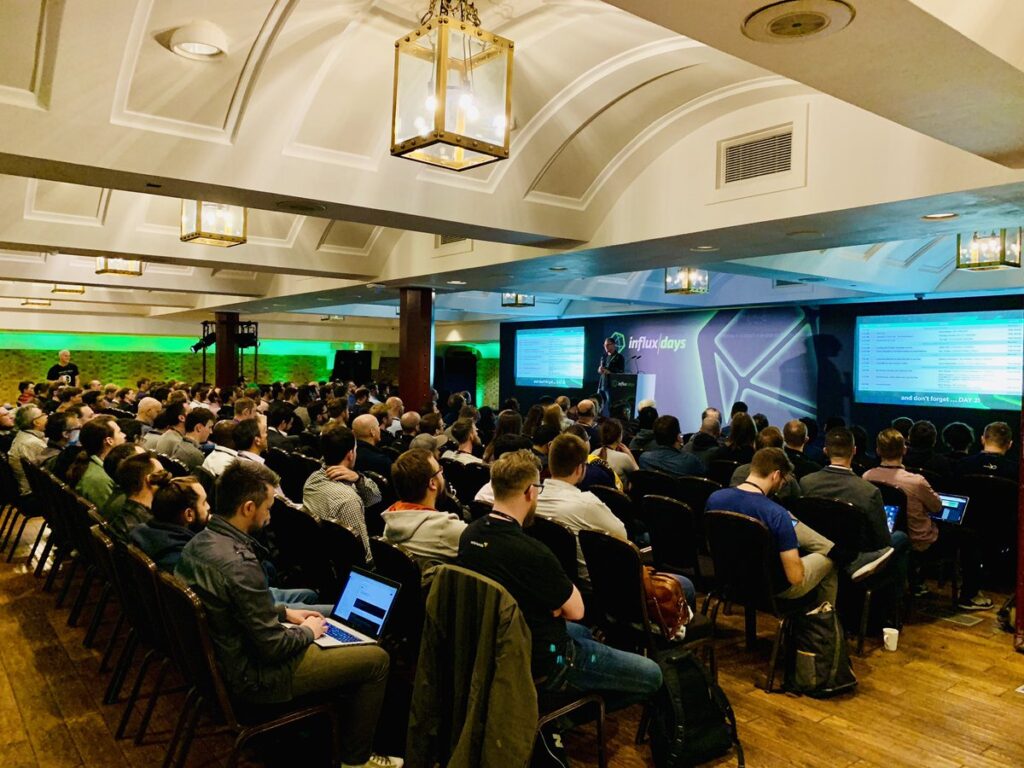
This year, the convention was hosted in London, more precisely in the Brewery which is specialized in hosting corporate venues in the Finsbury district of London.


Given the very fast pace of changes in the industry with new languages, new APIs, new partnerships and a complete shift from 1.x to 2.x, expectations were high.
What are the key facts that were announced and what’s in the future for developers?
In this article, we are going to have a complete look at all the new features announced for the future of InfluxDB.
I chose to have a special section for the recent industry collaborations and a community chapter to conclude this recap.
Without further ado, here are the key facts of InfluxDays London 2019.
I – From InfluxDB 1.x to InfluxDB 2.x
If you have been working with InfluxDB for quite some time, you already know about the TICK stack, composed of Telegraf, InfluxDB, Chronograf and Kapacitor.
All those components cover a very specific use case, whether it is about visualization with Chronograf, stream processing and analysis with Kapacitor or metrics gathering using Telegraf.
However, some of those components showed some limitations, in addition to the inability of InfluxQL to scale up besides being a great ramp for the platform at the beginning.
That’s the reason why InfluxData invested in InfluxDB 2.0, unveiling the Flux language and revamping the whole platform thus inherently putting an end to the TICK stack as we used to know it.
The announcements made in InfluxDays London confirmed the transition.
a – InfluxDB as a single platform
Influx is much more than just InfluxDB. Even if the product is called InfluxDB 2.0, the single UI platform that InfluxData is building is doing way more than that.
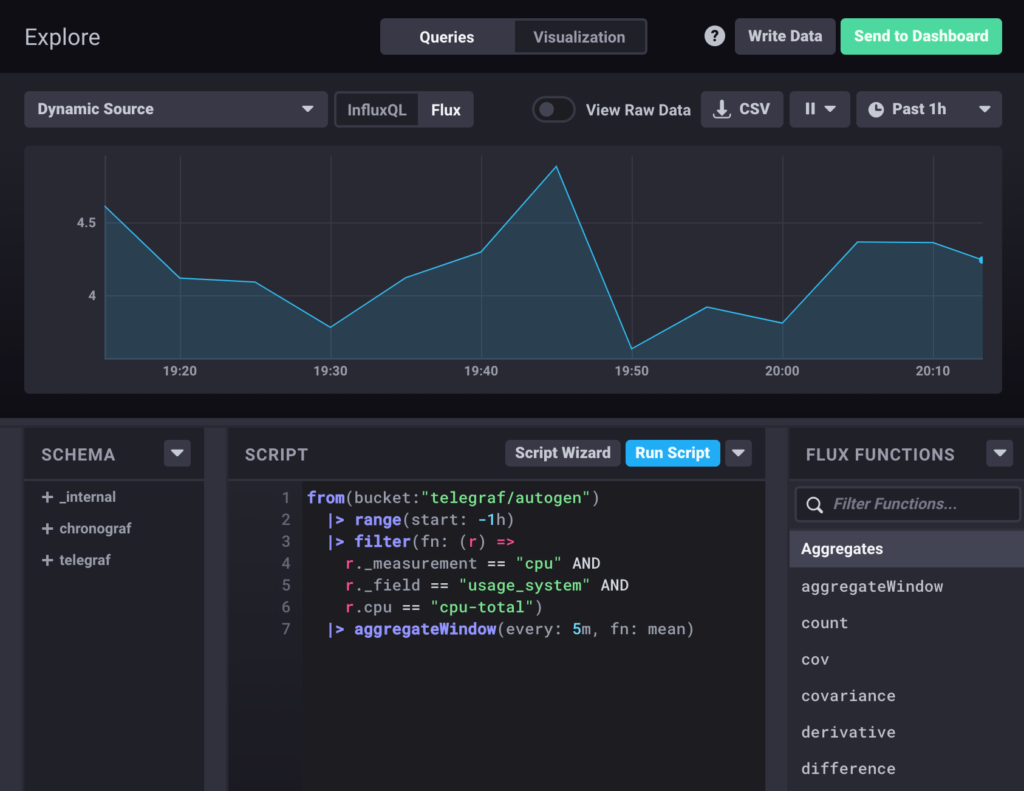
Right now, Chronograf is integrated directly into the InfluxDB 2.0 platform. You have a real coexistence of the two products and you don’t have to rely on two different products to visualize data anymore.
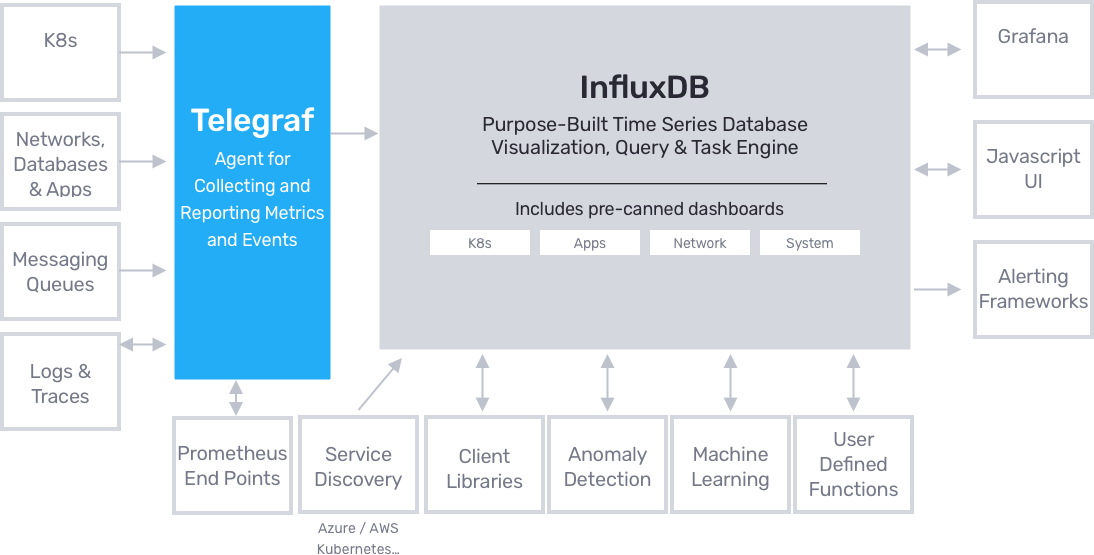
As you can see, InfluxDB is stated to be a time series database visualization (Chronograf aspect of it), query and task engine (tasks will be explained a little bit later).
Having a single platform for everything is interesting.
Developers are often hesitant about installing many different tools as it means that it will create maintenance costs for every single tool in the stack.
With two different products and Telegraf remaining an entity on its own, the data visualization and manipulation is done in a single place.
Opinion
Having a single platform for pretty much everything is definitely interesting.
It is definitely a great UI/UX challenge as it can be hard to design tools that are functionally that ambitious.
However, from the live demonstrations that I saw on Friday (the workshop day), the process seems smooth enough.
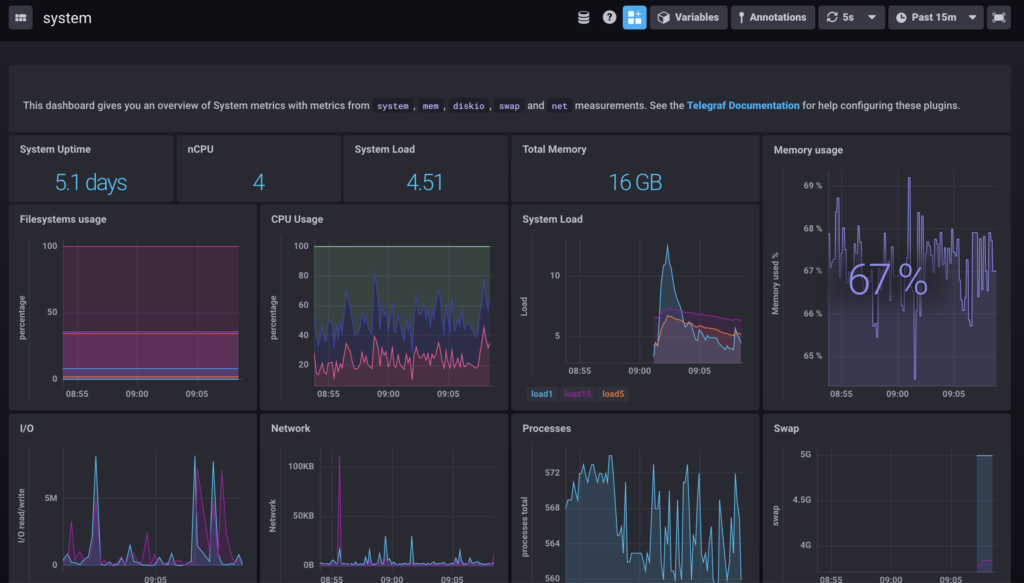
InfluxData definitely delivers on the “Time To Awesome” feature. Besides being a great marketing catchword, it is actually reinforced by the predefined templates (for your system, a Docker or a Kubernetes instance) that can create a complete dashboard in seconds.
Links
InfluxDB 2.0 Announcements and Future Ahead – by Paul Dix
b – Emphasis on Flux
As stated before, Flux is a new data scripting and query language built by InfluxData.
Flux comes as a replacement of InfluxQL and provides an API, built on the concepts of piping, i.e sequencing, operations in order to manipulate data. You can for example send data to third-party services, pivot it or perform join operations on it.
For those interested, I wrote an article on the difference between Flux and SQL.
But Flux isn’t only a language. It has also a query planner, a query optimizer as well as a CLI (or a REPL) that one can use in order to directly test Flux functions.
The major evolution here is that Flux is seen as a first-class citizen, and not a subpart of InfluxDB itself.
In a way, Flux should exist on its own.
InfluxData, via its CEO voice Paul Dix, clearly stated that they want Flux to integrate with other systems and that other languages might be transpiled to Flux in the future.
Maybe we could see an efficient transpilation from SQL to Flux in the future? Opinions diverge.
Opinion
For those following the blog, you know that I advocate technologies that are designed to reach the widest possible audience. Languages should not be created for elite programmers especially when they are aimed at data manipulation and analysis.
Flux is definitely designed that way.
With an expressive API, that one can easily understand, it should not be too hard for non-tech people to manipulate it and bring value easily.
Even if Flux is theorically impressive, and well documented, I believe that its potential will be confirmed by real use cases and popularized by developers becoming way more productive than with other languages.
c – Tasks
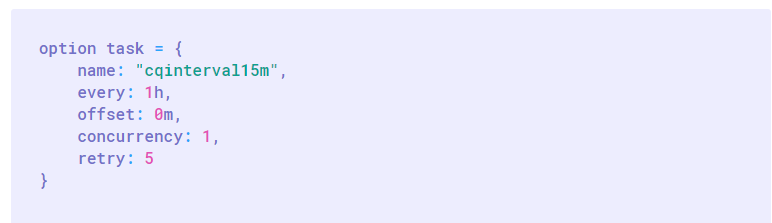
In short, tasks are scheduled jobs that one can run in order to manipulate, transform or transfer data.
They can be seen as cron jobs following a very special syntax close to JSON.
The goal here is to have small units that perform tasks on their own.
Task contain Flux scripts and should be composable to perform multiple operations.
Administrators are able to create tasks templates that can be used by all the users afterwards. I believe this is a great point when you want to reuse some of the work you have done previously.
Tasks can be managed via the InfluxDB UI, the CLI and with the new API that InfluxData is building very specifically for tasks.
This API will provide a set of endpoints (such as /create or /delete) for you to easily perform some administrative operations on your tasks.
Tasks are versioned, so you could theorically go back to a specific version if your new task isn’t satisfying enough.
Finally, you have tasks runs and tasks logs directly in the interface to see when your task was run and if it was run successfully.
What about alerts and notifications?
Alerts and notifications channels are still a very big part of InfluxDB 2.0.
Special APIs were created for alerts and notifications and you should theorically be able to create, modify or delete alert rules easily.
Opinion
In my opinion, the real challenge with tasks is about defining the best practices around it.
Having tasks that perform small operations is interesting for debugging purposes. Also, with runs and logs, you can have feedback on how your actions perform.
However, having small and independant units can lead to a very large pool of tasks to maintain, as well as code duplication probably leading to bug duplication.
There is a big challenge for developers to create an efficient data flow that is not too convoluted. Tasks are probably easy to create, but they should not be seen as the ultimate option to perform every single operation on your database.
For example, do you find tasks adapted for data cleansing?
Wouldn’t it be more adapted to perform it before inserting your data in the platform?
Do’s and don’ts will definitely be needed.
d – Giraffe and Clockface

Giraffe and Clockface are two products that were announced in InfluxDays 2019 London.
Right now, InfluxDB 2.0 provides a wide panel of visualizations for your metrics.
Graphs, scatter plots, single stats, histograms and many more are provided by default in the interface.
However, InfluxData wants developers to be able to build their own visualizations.
Following the recent moves made by Grafana, moving from Angular panels to React panels, InfluxData created two libraries that allow developers to build their own panels and share them.
Giraffe
Giraffe is a library that is leveraging React components to provide a complete API for developers to use.
Pretty much like Grafana plugins, we can imagine that InfluxData is going to build a place for people to share their panels.
For now, the library is still in the pre-alpha stage, but I’ll share more info about it as soon as it becomes available to the public.
Clockface
At first, I had some trouble understanding the actual difference between Giraffe and Clockface.
Giraffe is designed for Chronograf-like panels and Clockface is designed to build visualization applications.
In short, it allows you to tweak the existing interface to add actions that are not existing natively in the platform.
Let’s say that you want to create a button on InfluxDB 2.0 that hides a certain panel that you find not that useful.
You would do it using Clockface, creating a button and performing some Javascript operations to hide the panel.
e – User Packages
User packages are another big part of the next features of InfluxDB 2.0. Pretty much like NPM packages, Influx packages are meant to allow developments of any kind of logic into the platform without having to perform a pull request.
Proposals were made for interacting with Influx packages, such as a CLI with custom functions such as:
> influx package init
> influx package publish
You can define types and rules inside a configuration file that is very similar to a package.json file in Node ecosystems.
Warning : Influx user packages are different from Flux packages.
Flux packages are used to import Flux functions that were already coded and that you would want to use in a new Flux function.
II – Recent Industry Collaborations
In this industry, I believe that collaboration is one of the ways to succeed.
Most of the existing products (at least Grafana, InfluxDB and Prometheus) are working towards improving the interoperability of their respective products.
What do we mean by interoperability?
Even if those tools are not accepting the same metrics format, and not dealing with the same APIs, there is a work in progress in accepting various different formats in InfluxDB.
a – Grafana
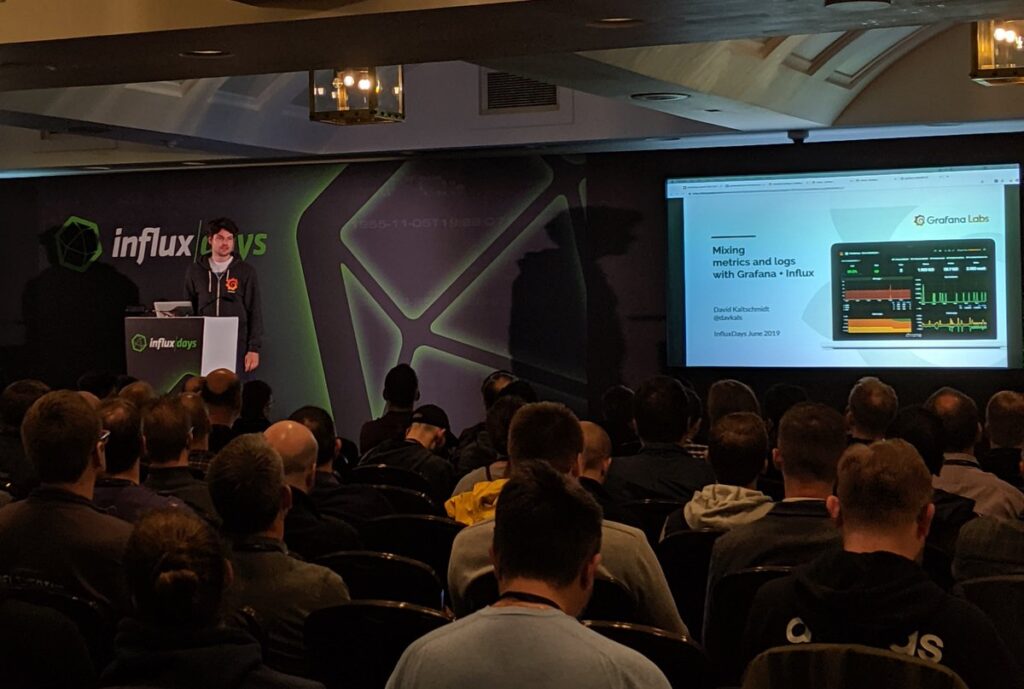
Even if InfluxDB 2.0 definitely intersects some of the features of Grafana, Grafana still provides new ways to monitor your InfluxDB metrics.
Both InfluxDB and Grafana are working on data exploration features.
Grafana wants to become an observability platform. It means that Grafana can be used to monitor real time data, but it also can be used to have a closer look at certain metrics, and even compare them with metrics from other buckets or databases.

b – Prometheus & Flux Transpilation
We know that Prometheus and Flux works quite differently when it comes to data querying.
As a reminder, I explained how Prometheus querying via PromQL worked in my Prometheus guide.
One of the news that was unveiled at InfluxDays London 2019 was the transpiling work done from Prometheus to Flux.
The goal of this project is to have InfluxDB as a long term storage for Prometheus. Prometheus queries would be run against this transpiler to produce Flux code.
Flux code would then be interpreted by the dedicated Flux interpreter and run on the Flux engine.
Julius Volz revealed his advancements on this project, explaining how he designed the data mapper (with metric names as fields, measurement being ‘Prometheus’, label names being column names and so on).
He also explained how he used abstract syntax trees to map PromQL functions to a Flux pipeline.
Remarks : there are still some concerns regarding the speed performances of the transpiling process.
InfluxData and Prometheus are working on a way to make join operations more efficient, thus inducing faster transpiling operations.
III – Real World Use Cases
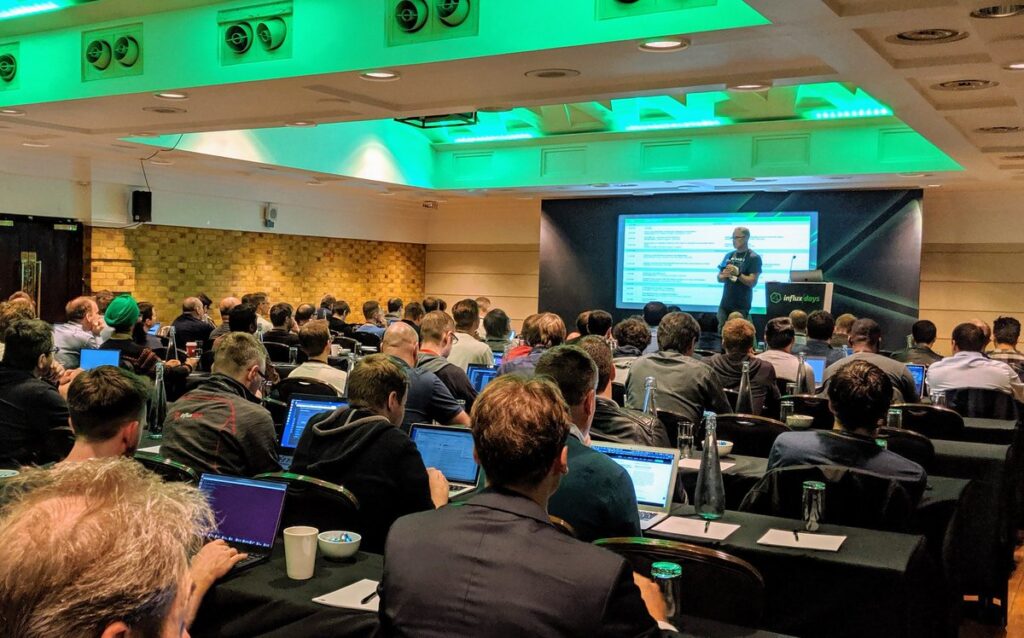
During InfluxDays London, many of the talks were done by guest speakers. Guests came from very different industries and showcased on they used InfluxDB for their own needs.
This is in my opinion the most interesting part of the convention, as it featured many different use cases that highlighted how InfluxDB is solving problems in the real world.
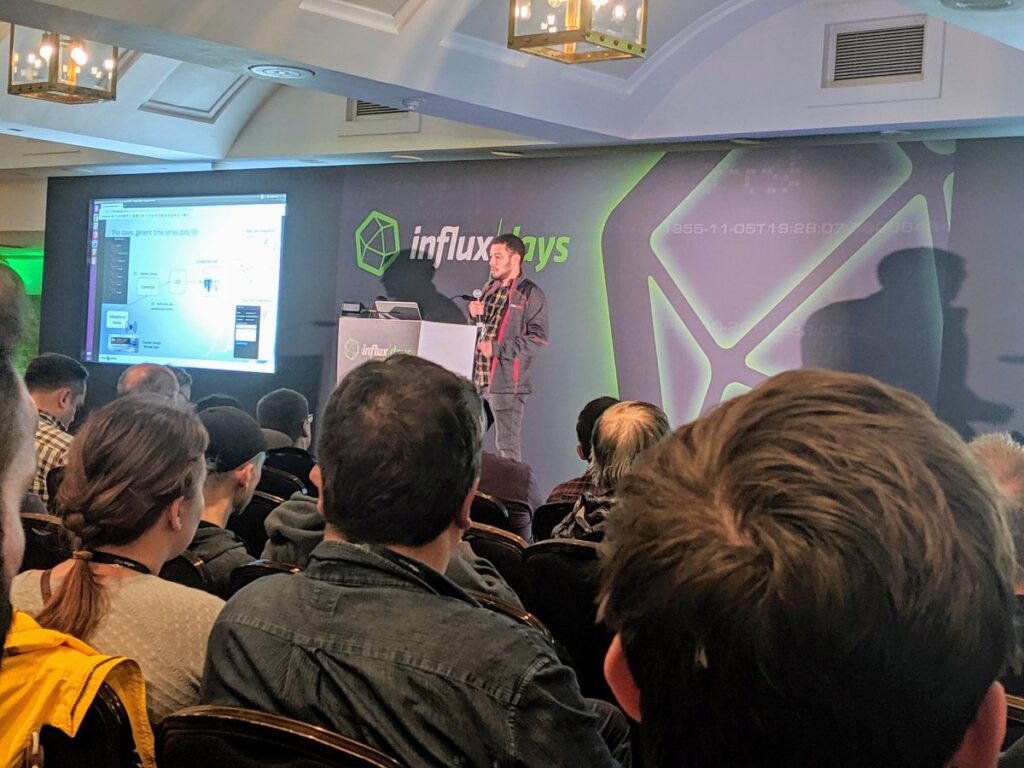
a – Playtech
This talk was presented by Alex Tavgen, technical architect for Playtech which is a popular gambling software development company.
Alex Tavgen unveiled his views on architecturing monitoring solutions and provided very concrete examples on how they should be designed.
His talk was centered around the following points :
- “Managing a zoo” is hard: when developers are free to choose their stacks, it often leads to having teams with many different stacks which leads to obvious maintenance issues;
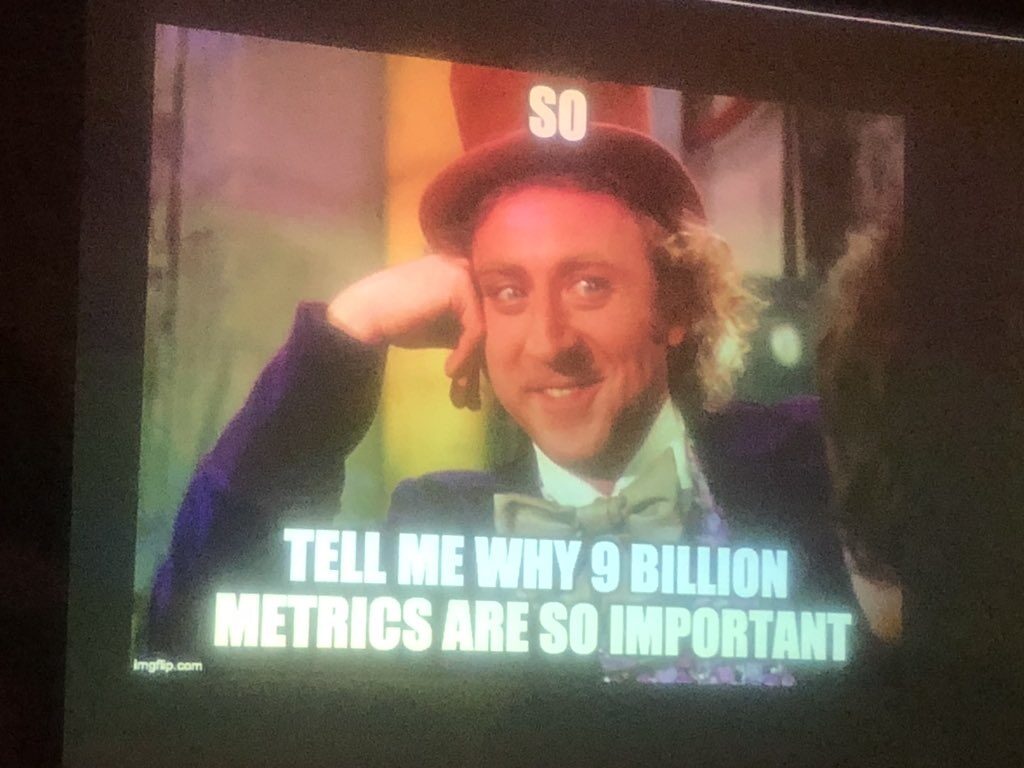
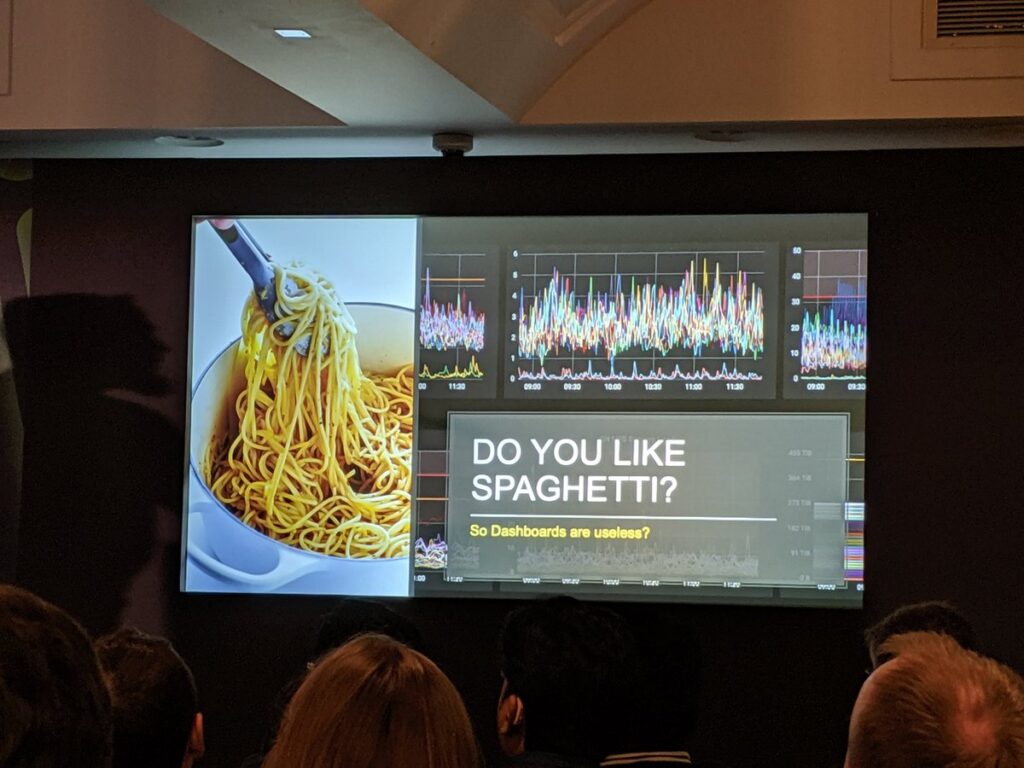
- Abusive use of dashboards: it is tempting to record everything, just in case. More is not better in monitoring, and metrics should not be monitored for the sake of it. We need to bring actual sense in monitoring;
- Are dashboards useless? No but humans need to know what they have to look for in a dashboard. Dashboarding needs guidance and documentation;
- Anomaly detection to preserve client trust: you should tell the client that he has an issue, and not the other way around. Many investments were made to improve actual anomaly detection, not just outlier detection. Alex Tavgen explained how he used machine learning to create a predictive engine that raises alerts when it truly matters. (they also plan to open source their Java engine).
b – Worldsensing

This talk was presented by Albert Zaragoza, CTO and Head of Engineering at WorldSensing.
Worldsensing is a company that provides monitoring solutions and intelligent components, leveraging IoT and time series databases to build smart cities.
They provide intelligent parking solutions, as well as traffic flow solutions among other products.
Worldsensing produces client facing applications, providing real time feedback with an extensive use of monitoring dashboards. As part of their infrastructure, Worldsensing uses Kapacitor and Flux in order to provide fast and reliable information to their end clients.
I will provide a link to the video as soon as it is available. However, if you use Postgres databases or if you are interested in providing spatio-temporal feedback to your clients, you should definitely check what they are doing at Worldsensing.
III – Community
The InfluxDays London 2019 was also a great moment for us to talk and share our experiences with InfluxDB and the other products of its ecosystem.
a – InfluxAces
InfluxAces share their knowledge on a variety of ways, online and offline, through blogging, podcasting, attending meetups, answering community questions, building courses.. the list goes on!
And I am part of them now! Thank you!
A couple of days ago, I wrote about how to contribute to devconnected as a writer.
As part of the InfluxAces program, I want to encourage creators and builders to submit their original articles to us as long as it is related to the subjects detailed in the article, and of course to InfluxDB.
On my side, I will keep on writing about those technologies because I believe that they will shape the world of tomorrow.
b – Community Links
Meetups and conventions are a great to connect with people. But they are not the only way to do it.
If you are interested in InfluxDB, you should:
- Join the Slack community available here.
- Ask your questions in the community forum (and have your questions answered by MarcV)
- Tweet to or about InfluxDB on Twitter.
A Closing Word
On a technological level, it was truly inspiring to see how fast those technologies change and evolve in a such a short amount of time.
The progress made so far is huge and and it looks very promising for the future.
At the InfluxDays London, I was lucky to be able to connect with passionate and humble people from all over the world. I was able to share my views on the future, and to listen to what the others had to say about it.
Sure, I learned more about InfluxDB, but I learned even more about the people behind the scenes, whether they are working for InfluxData or not.
Engineers, developers, managers, or just curious individuals, they all share the same ambition to create, learn and to give back to the community.
The open source community is definitely an amazing community.
See you next year!
