
This guide details all the steps needed to setup the AlertManager with Prometheus on Linux systems.
When using modern monitoring solutions, we often want to be alerted when something goes wrong in our infrastructure.
We may want to receive an email if one of our hosts goes down.
Or we may want to receive a message on our team Slack if HTTPS certificates are about to expire for example.
In your monitoring infrastructure, setting up custom alerts is crucial.
You want to be alerted before your clients and customers if something goes wrong.
In this tutorial, we are going to take a special look at the AlertManager with Prometheus.
The AlertManager is a tool that will allow you to create custom alerts with Prometheus, and define recipients for them.
Ready?
1 – What You Will Learn
If you read this tutorial until the end, you will learn about the following concepts:
- How to setup Prometheus securely, in HTTPS with authentication.
- What is the AlertManager and how it binds with Prometheus
- How to install the AlertManager as a service, using HTTPS.
- How to configure the AlertManager and create your first rules.
Again, that’s quite a long program, let’s start working.
2 – Installing Prometheus (with SSL and authentication)
The complete Prometheus and Grafana installation and configuration was already covered in one of our previous articles.
If you followed carefully this tutorial, you should now have Prometheus configured behind a secure reverse proxy (NGINX in this case).
The authentication is also done on the reverse proxy side.
As a reference, the Prometheus Web UI was accessed using the following URL : https://localhost:1234.
When you are done, you can go to the next section.
3 – What is the AlertManager with Prometheus?
a – AlertManager general concepts
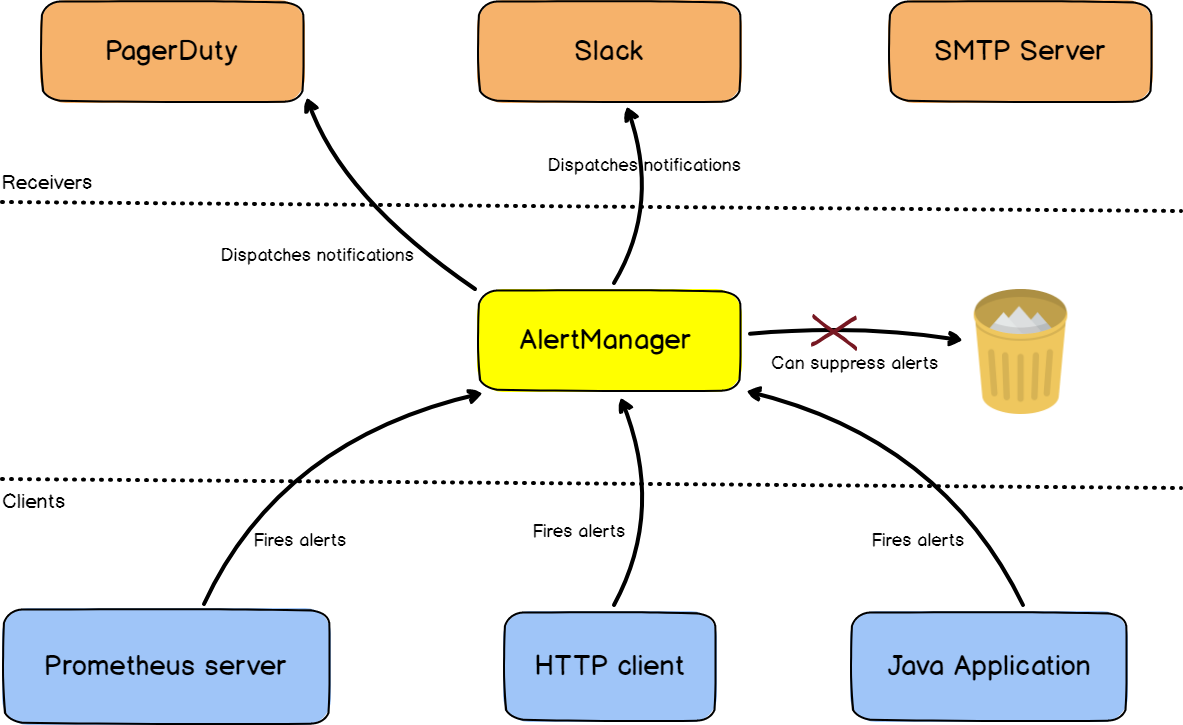
The AlertManager is an alerting server that handles alerts provided by a set of clients (a Prometheus server for example) and dispatches them to a group of defined receivers (Slack, email or Pagerduty for example).
As described, the AlertManager is part of the Prometheus stack, but it is run as a standalone server aside from Prometheus.
By default, Prometheus will take care of sending alerts directly to the AlertManager if it is correctly configured as a Prometheus target.
If you are using clients different from Prometheus itself, the AlertManager exposes a set of REST endpoints that you can use to fire alerts.
The AlertManager API documentation is available here.
b – What are the AlertManager routes?
The AlertManager works with configuration files defined in YAML format.
At the top of your configuration file, you are going to define routes.
Routes are a set of paths that alerts take in order to determine which action should be associated with the alert. In short, you associate a route with a receiver.
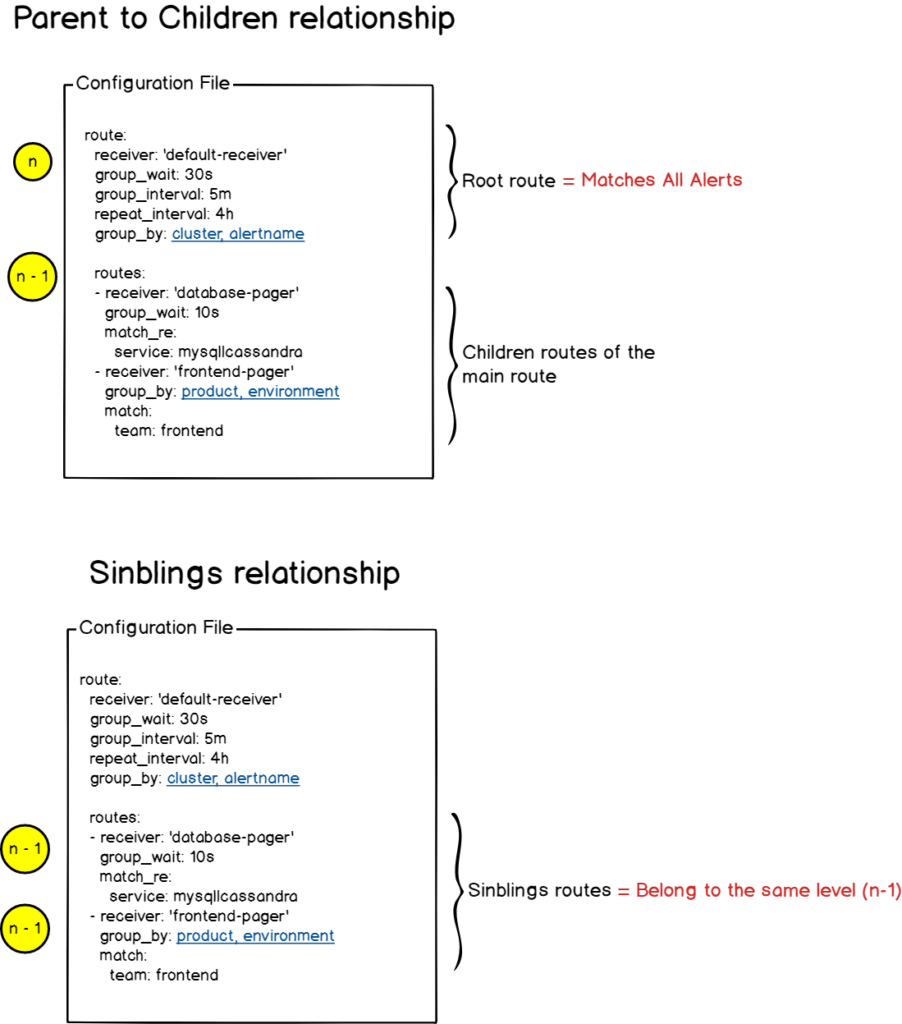
The initial route, also called the “root route” is a route that matches every single alert sent to the AlertManager.
A route can have siblings and children that are also routes themselves. This way, routes can be nested any number of times, each level defining a new action (or receiver) for the alert.
Each route defines receivers. Those receivers are the alert recipients : Slack, a mail service, Pagerduty..
As always, a schema is better than words.
c – How are the AlertManager routes evaluated?
Now that you have a better idea of what the AlertManager routes are, let’s see how they are evaluated.
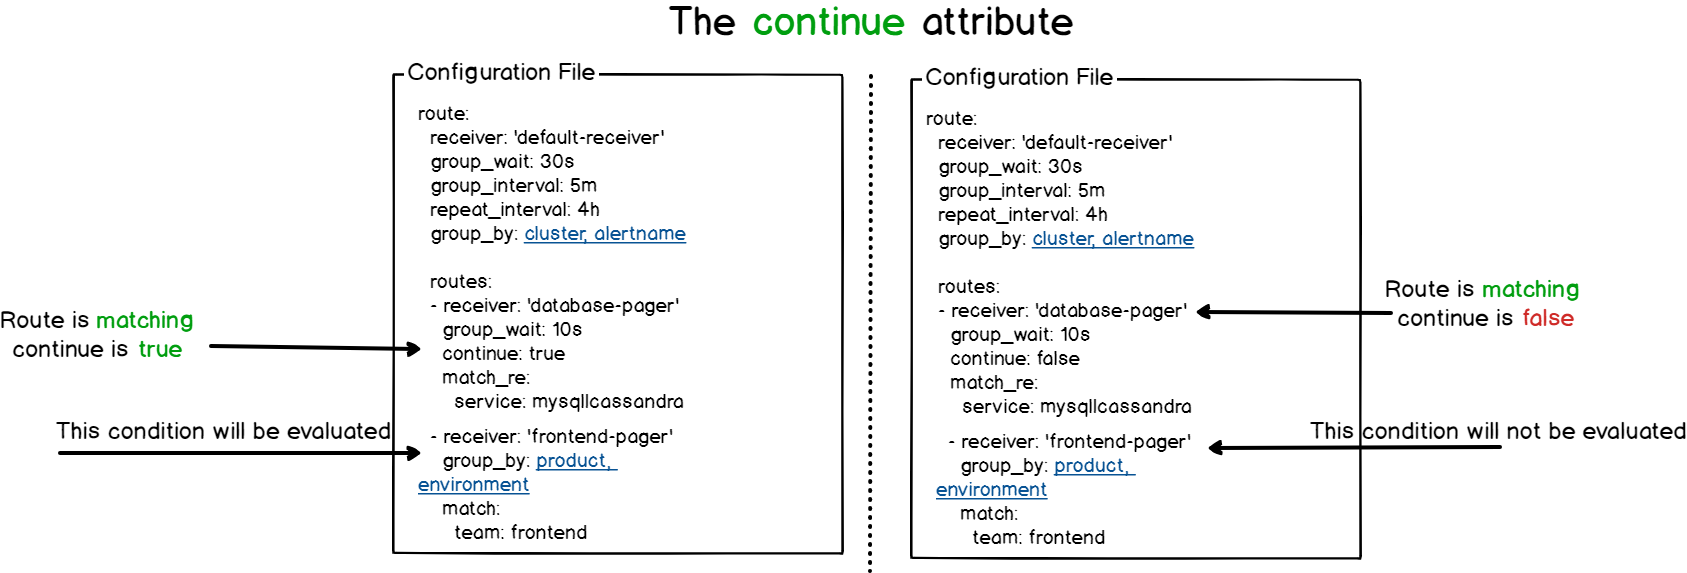
On each route, you can define a continue attribute.
The continue attribute is a value used to define if you want to evaluate route siblings (belonging to the same level) if a route on the same level was already matching.
Note that the continue attribute is not used to determine if you want to go accross children routes, but only siblings routes.
The AlertManager will evaluate children routes until there are no routes left or no routes for a given level are matching the current alert.
In that case, the AlertManager will take the configuration of the current node evaluated.
Now that you have a better understanding of how alerts work on Prometheus, it is time for us to start configuring it on our Linux system.
4 – Installing the AlertManager with Prometheus
First, we are going to download the latest version of the AlertManager and configure it as a server on our instance.
a – Downloading the AlertManager
In order to install the AlertManager, head over to Prometheus downloads page.
At the top of the page, filter your results by choosing Linux as an operating system.

Scroll a bit, and find the AlertManager section, right below the Prometheus executable.
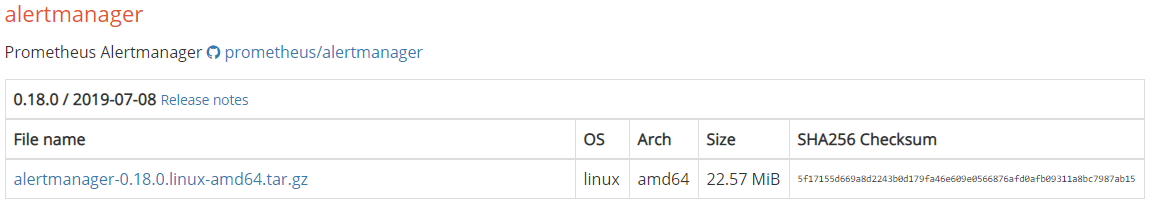
Click on the archive to download it, or run a simple wget command to download the file.
$ wget https://github.com/prometheus/alertmanager/releases/download/v0.18.0/alertmanager-0.18.0.linux-amd64.tar.gzYou should now have the archive on your system.
Extract the files from the archive.
$ tar xvzf alertmanager-0.18.0.linux-amd64.tar.gz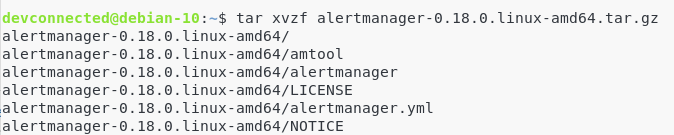
In the folder where you extracted your files, you should find the following entries:
- amtool: the amtool is an executable that allows you to view or to modify the current state of the AlertManager. In other words, the amtool can silence alerts, expire silences, as well as import silences or query them. It can be seen as a utility to customize the AlertManager without directly modifying the configuration of your current alerts.
- alertmanager: the executable for the alertmanager. This is the executable that you will run in order to start an AlertManager server on your instance.
- alertmanager.yml: as its name suggests, this is the configuration file for the AlertManager. This configuration file already defines some example routes, but we will create our own alert file.
If you are interested, here’s the documentation of the amtool.
Now that you have downloaded the AlertManager, let’s see how you can launch it as a service.
b – Starting the AlertManager as a service
In order to start the AlertManager as a service, you are going to move the executables to the /usr/local/bin folder.
$ sudo mv amtool alertmanager /usr/local/binFor the configuration files, create a new folder in /etc called alertmanager.
$ sudo mkdir -p /etc/alertmanager
$ sudo mv alertmanager.yml /etc/alertmanager
Create a data folder at the root directory, with a prometheus folder inside.
$ sudo mkdir -p /data/alertmanagerNext, create a user for your upcoming service.
$ sudo useradd -rs /bin/false alertmanagerGive permissions to your newly created user for the AlertManager binaries.
$ sudo chown alertmanager:alertmanager /usr/local/bin/amtool /usr/local/bin/alertmanagerGive the correct permissions to those folders recursively.
$ sudo chown -R alertmanager:alertmanager /data/alertmanager /etc/alertmanager/*Awesome! Time to create the service.
To create a Linux service (using systemd), head over to the /lib/systemd/system folder and create a service named alertmanager.service
$ cd /lib/systemd/system
$ sudo touch alertmanager.service
Similarly to our Prometheus, let’s first run the alertmanager executable with a “-h” flag to see our options.
$ alertmanager -h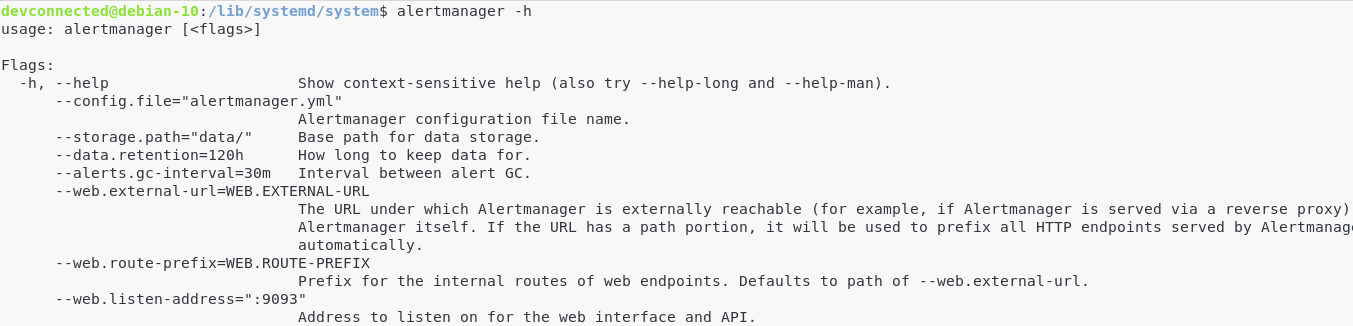
In this case, we are interested in a couple of options:
- config.file: we need to set this variable to the correct configuration file of the “etc/alertmanager” folder.
- storage.path: again, we defined a custom folder for data which is “/data/alertmanager”
- web.external-url: if you followed the Prometheus setup entirely, your Prometheus instance is running behind a reverse proxy. In this case, we are going to set the URL for the AlertManager to be externally reachable. Note that this step is optional, but if you plan on reaching the AlertManager from the outside world, there is a chapter dedicated to it.
Edit your service file, and paste the following content inside.
$ sudo nano alertmanager.service

[Unit]
Description=Alert Manager
Wants=network-online.target
After=network-online.target

[Service]
Type=simple
User=alertmanager
Group=alertmanager
ExecStart=/usr/local/bin/alertmanager \
  --config.file=/etc/alertmanager/alertmanager.yml \
  --storage.path=/data/alertmanager

Restart=always

[Install]
WantedBy=multi-user.target
Save your file, enable the service and start it.
$ sudo systemctl enable alertmanager
$ sudo systemctl start alertmanager
Now that the AlertManager is running, let’s verify that everything is running properly.
By default, the AlertManager is running on port 9093 (http://localhost:9093).
This is the Web UI that you should see on your instance.
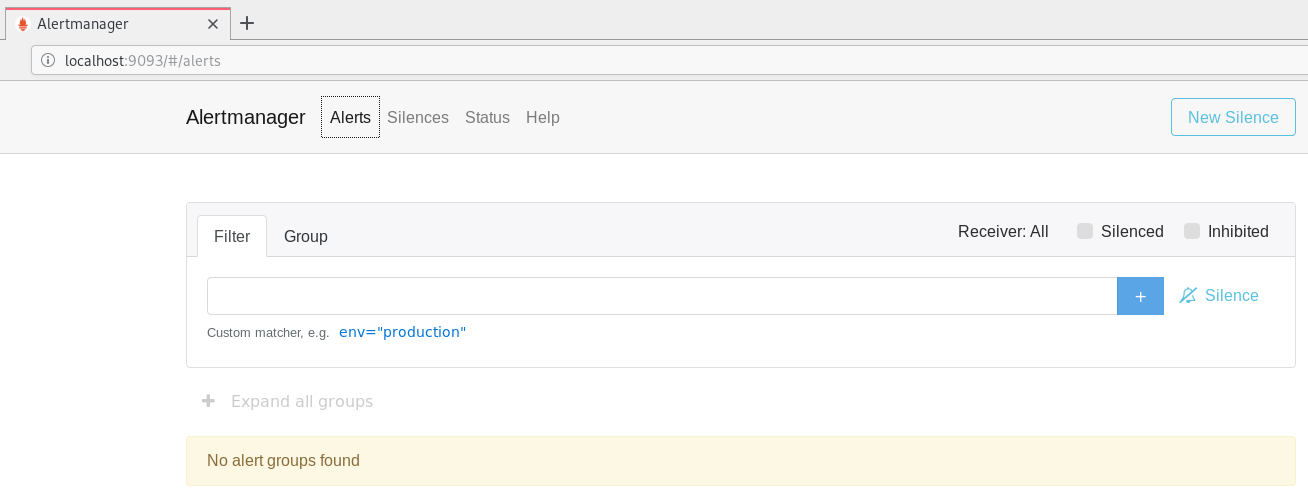
Not accessible on port 9093? Run a simple lsof command to determine the port on which the AlertManager is currently listening.
Awesome! Our AlertManager is up and running.
Now, it is time to tell Prometheus to bind with the AlertManager.
c – Binding AlertManager with Prometheus
Go back to your Prometheus configuration directory, and edit the following changes.
$ cd /etc/prometheus/prometheus.yml


alerting:
  alertmanagers:
  - static_configs:
    - targets:
      - localhost:9093
Restart Prometheus, and make sure that everything is running smoothly.
$ sudo systemctl restart prometheusIn the next chapter, we are going to configure it to be remotely accessible behind a reverse proxy. The next chapter is optional, so if you want to skip it, you can directly read the section on building our first alert with Slack.
5 – Setting up a reverse proxy for the AlertManager (optional)
The reverse proxy setup with NGINX was already covered in our previous tutorial. (see Prometheus & Grafana setup)
Make sure to read this part and to come back to this tutorial once you have everything ready.
a – Creating a proxy configuration file
Similarly to our Prometheus proxy configuration file, we are going to create one for the AlertManager.
The conf.d directory is where we are going to create our reverse proxy configuration file for the AlertManager.
Create a new file in this directory called alertmanager.conf.
$ cd /etc/nginx/conf.d
$ sudo touch alertmanager.conf
Paste the following content in your file.
server {
listen 3456;
location / {
proxy_pass http://localhost:9093/;
}
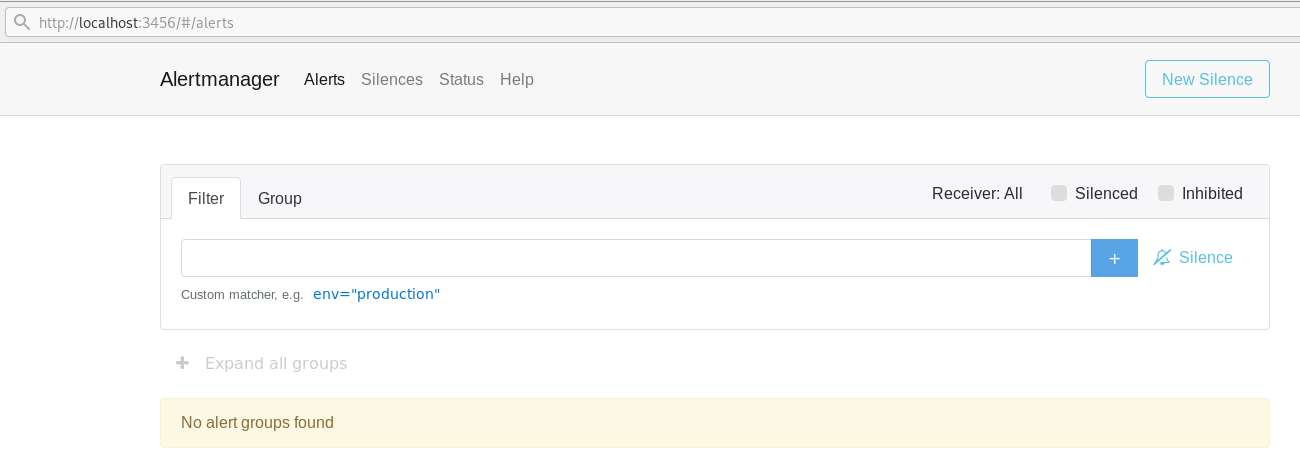
}I chose the port 3456 for my AlertManager but feel free to choose a port that fits your infrastructure.
Save your configuration, and restart your NGINX server for the modifications to be applied.
$ sudo systemctl restart nginx
-- Any errors? Inspect your journal
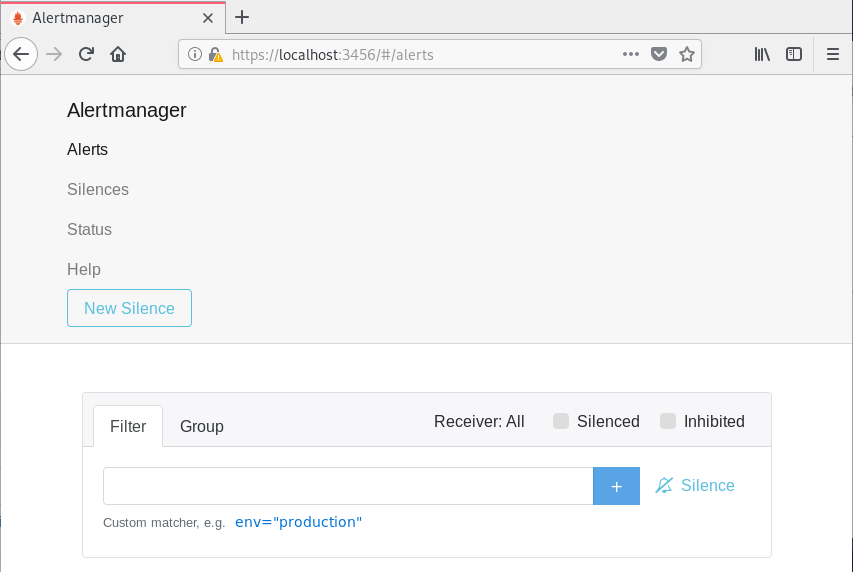
$ sudo journalctl -f -u nginx.serviceThis is what you should now see (when browsing http://localhost:3456)
Awesome, let’s have some reverse proxy authentication for the AlertManager now.
b – Setting up the reverse proxy authentication
If you want to use the Prometheus credentials file described in the previous tutorial, you can.
In this case, I am going to create a brand new authentication file dedicated to the AlertManager.
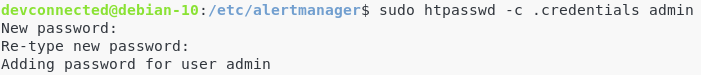
First, you are going to need the htpasswd utility in order to create the authentication file.
This utility comes with the apache2-utils package, so make sure to install it first.
$ sudo apt-get install apache2-utils
$ cd /etc/alertmanager
$ sudo htpasswd -c .credentials admin
Again, choose a strong password as this endpoint is supposed to be accessible online.
Back to your NGINX configuration file (located at /etc/nginx/conf.d), change your server configuration to take into account the new credentials.
$ cd /etc/nginx/conf.d

server {
    listen 3456;

    location / {
      auth_basic           "AlertManager";
      auth_basic_user_file /etc/alertmanager/.credentials;
      proxy_pass           http://localhost:9093/;
    }
}
Great! You should now be asked for credentials when trying to reach http://localhost:3456.
c – Securing the AlertManager with TLS/SSL
We have already covered those steps in our Prometheus & Grafana guide, but in a similar way we are going to create self signed certificates and import them in NGINX.
Create Keys for the AlertManager
First, make sure that you have the gnutls packages available on your distribution.
As a reminder, here’s how to install them.
(Ubuntu)
$ sudo apt-get install gnutls-utils

(Debian)
$ sudo apt-get install gnutls-bin
Go to your /etc/ssl directory, and create a new folder for the AlertManager.
$ cd /etc/ssl
$ sudo mkdir alertmanager
Go to your new folder, and create a private key for the AlertManager.
$ sudo certtool --generate-privkey --outfile alertmanager-private-key.pemWhen you are done, create a new certificate (also called public key).
$ sudo certtool --generate-self-signed --load-privkey alertmanager-private-key.pem --outfile alertmanager-cert.pem
  # The certificate will expire in (days): 3650
  # Does the certificate belong to an authority? (Y/N): y
  # Will the certificate be used to sign other certificates? (Y/N): y
  # Will the certificate be used to sign CRLs? (y/N): y
Choose a validity that works for you, in this case I chose 10 years.
Now that your keys are created, let’s add them to our NGINX configuration.
Reconfiguring NGINX for HTTPS
Find your configuration in the /etc/nginx/conf.d directory, and paste the following changes.
$ cd /etc/nginx/conf.d
$ sudo nano alertmanager.conf

server {
    listen 3456 ssl;
    ssl_certificate /etc/ssl/alertmanager/alertmanager-cert.pem;
    ssl_certificate_key /etc/ssl/alertmanager/alertmanager-private-key.pem;

    location / {
      auth_basic           "AlertManager";
      auth_basic_user_file /etc/alertmanager/.credentials;
      proxy_pass           http://localhost:9093/;
    }
}
When you are done, restart your NGINX server, and verify that the changes were applied.
$ sudo systemctl restart nginxIf you have any trouble launching NGINX, make sure to run the following command.
$ sudo journalctl -f -u nginx.serviceModifying the AlertManager service
Now that NGINX is configured to deliver content via HTTPS, let’s modify the service to take into account the external URL parameter.
Back to the /lib/systemd/system folder, modify the service accordingly.
$ cd /lib/systemd/system
$ sudo nano alertmanager.service

[Service]
Type=simple
User=alertmanager
Group=alertmanager
ExecStart=/usr/local/bin/alertmanager \
  --config.file=/etc/alertmanager/alertmanager.yml \
  --storage.path=/data/alertmanager \
  --web.external-url=https://localhost:3456
Save your file and restart your service.
$ sudo systemctl daemon-reload
$ sudo systemctl restart alertmanager
Make sure that your AlertManager is still accessible via the proxy.
6 – Conclusion
In this tutorial, you had a complete overview on how to setup the AlertManager with Prometheus.
You have successfully setup an AlertManager instance running behind a reverse proxy, with authentication and encryption.
As I write more articles using the AlertManager rules and alerts, those articles will probably be linked here.
I hope that you learnt something new today.
Until then, have fun, as always.
13 comments
[…] AlertManager and Prometheus Complete Setup on Linux […]
[…] is noteworthy to say that the Blackbox exporter can be bound with the AlertManager and Prometheus in order to have detailed alerts when one endpoint goes […]
Don’t works for me 🙁
alertmanager.service – Alert Manager
Loaded: loaded (/lib/systemd/system/alertmanager.service; enabled; vendor preset: enabled)
Active: failed (Result: exit-code) since Mon 2019-12-30 18:06:18 UTC; 4s ago
Process: 3758 ExecStart=/usr/local/bin/alertmanager –config.file=/etc/alertmanager/alertmanager.yml –storage.path=/data/alertmanager (code=exited, status=1/FAILURE)
Main PID: 3758 (code=exited, status=1/FAILURE)
Dec 30 18:06:17 monitoring systemd[1]: alertmanager.service: Main process exited, code=exited, status=1/FAILURE
Dec 30 18:06:17 monitoring systemd[1]: alertmanager.service: Failed with result ‘exit-code’.
Dec 30 18:06:18 monitoring systemd[1]: alertmanager.service: Service hold-off time over, scheduling restart.
Dec 30 18:06:18 monitoring systemd[1]: alertmanager.service: Scheduled restart job, restart counter is at 5.
Dec 30 18:06:18 monitoring systemd[1]: Stopped Alert Manager.
Dec 30 18:06:18 monitoring systemd[1]: alertmanager.service: Start request repeated too quickly.
Dec 30 18:06:18 monitoring systemd[1]: alertmanager.service: Failed with result ‘exit-code’.
Dec 30 18:06:18 monitoring systemd[1]: Failed to start Alert Manager.
Hello,
Thank you for your comment.
Can you try starting the Alert Manager from the command line and see if you have more meaningful error messages?
If you do I’m willing to assist you further.
Thank you.
Hello,
I cant find the section of sending alerts on slack
You do it like no others. Kudos.
will you please make a tutorial of how to run alertmanager as a container alongside Prometheus and node-exporter containers?
that’d be sick.
Worked just fine with me, already in my ansible playbooks 🙂
Great job, thanks
When creating the alertmanager.service on my Ubuntu 20.04 I had to add ‘–cluster.advertise-address=0.0.0.0:9093’ to the command line for the service to run.
Awesome man! Thanks for sharing.
Hi!
We have setup promethues in our environment with Node_exporter. We use alert manager to send email message to our team. We are able to receive the email.
We also try to configure the SMS in alertmanager so that we got an alert if any services are down and resolved in our mobile phone.
Could some one suggest how to do the cnofiguration in Alertmanager. We have an our Internal SMS api, and we need to integrate with alertmanager to get the alerts on our mobile phone number.
Kindly share some light on the above subject.
It may be a very basic question but we stuck with it.
Thanks in Advance.
Thanks & Regards,
Hamid Mehmood
Didn’t see alert manager config file in blog.
Alert manager service failed to start:-
[root@localhost system]# sudo systemctl status alertmanager
● alertmanager.service – Alert Manager
Loaded: loaded (/etc/systemd/system/alertmanager.service; enabled; vendor preset: disabled)
Active: failed (Result: start-limit) since Wed 2021-06-30 07:35:18 EDT; 23min ago
Process: 1910 ExecStart=/usr/local/bin/alertmanager –config.file=/etc/alertmanager/alertmanager.yml –storage.path=/data/alertmanager (code=exited, status=1/FAILURE)
Main PID: 1910 (code=exited, status=1/FAILURE)
Jun 30 07:35:17 localhost.localdomain systemd[1]: alertmanager.service: main process exited, code=exited, status=1/FAILURE
Jun 30 07:35:17 localhost.localdomain systemd[1]: Unit alertmanager.service entered failed state.
Jun 30 07:35:17 localhost.localdomain systemd[1]: alertmanager.service failed.
Jun 30 07:35:18 localhost.localdomain systemd[1]: alertmanager.service holdoff time over, scheduling restart.
Jun 30 07:35:18 localhost.localdomain systemd[1]: Stopped Alert Manager.
Jun 30 07:35:18 localhost.localdomain systemd[1]: start request repeated too quickly for alertmanager.service
Jun 30 07:35:18 localhost.localdomain systemd[1]: Failed to start Alert Manager.
Jun 30 07:35:18 localhost.localdomain systemd[1]: Unit alertmanager.service entered failed state.
Jun 30 07:35:18 localhost.localdomain systemd[1]: alertmanager.service failed.
Alertmanager service config:-
[root@localhost system]# cat /etc/systemd/system/alertmanager.service
[Unit]
Description=Alert Manager
Wants=network-online.target
After=network-online.target
[Service]
Type=simple
User=alertmanager
Group=alertmanager
ExecStart=/usr/local/bin/alertmanager \
–config.file=/etc/alertmanager/alertmanager.yml \
–storage.path=/data/alertmanager
Restart=always
[Install]
WantedBy=multi-user.target
One thing to add to the alertmanager systemd service file is –web.listen-address=0.0.0.0:9393. and run sudo systemctl daemon-reload and sudo systemctl restart alertmanager.service.
With the above parameter you don’t have to check the open port for alertmanager , instead you can access it on port 9393 as mentioned in your doc.