
If you are a Windows system administrator, or a site reliability engineer, you spend a lot of time monitoring your Windows servers.
Sometimes, your servers are down, but you can’t know why easily.
Is it because of a high CPU usage on one of the processes?
Is the server having some memory issues? Is the RAM used too much on my Windows server?
Today, after understanding how to do Linux system monitoring, we are taking a look at how to configure your Windows Server monitoring properly.
For this tutorial, we are going to use Prometheus, a modern time series database and monitoring platform.
If you are not familiar with Prometheus monitoring, you can have a look at one of the guides we crafted for you.
Ready to monitor your Windows servers?
I – What You Will Learn
If you follow this tutorial until the end, here are the key concepts you are going to learn about.
- How to install and configure Prometheus on your Linux servers;
- How to download and install the WMI exporter for Windows servers;
- How to bind Prometheus to your WMI exporter;
- How to build an awesome Grafana dashboard to visualize your metrics.
Quite a long program, let’s jump into it.
II – Windows Server Monitoring Architecture
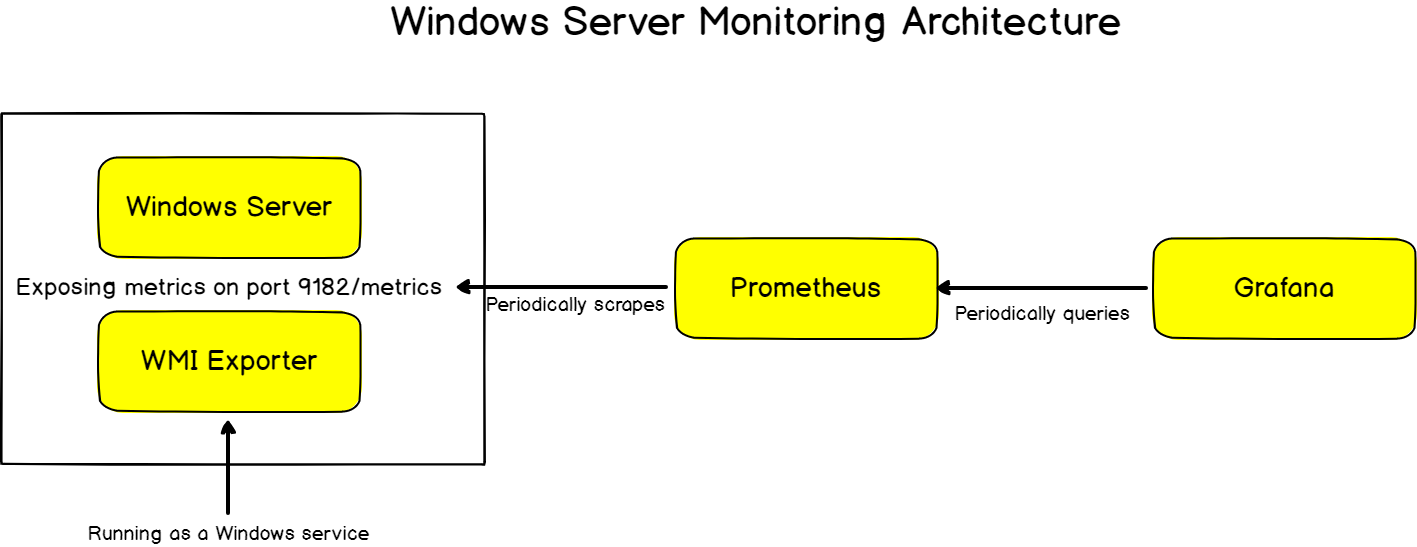
Before installing the WMI exporter, let’s have a quick look at what our final architecture looks like.
As a reminder, Prometheus is constantly scraping targets.
Targets are nodes that are exposing metrics on a given URL, accessible by Prometheus.
Such targets are equipped with “exporters” : exporters are binaries running on a target and responsible for getting and aggregating metrics about the host itself.
If you were to monitor a Linux system, you would run a “Node Exporter“, that would be responsible for gathering metrics about the CPU usage or the disk I/O currently in use.
For Windows hosts, you are going to use the WMI exporter.
The WMI exporter will run as a Windows service and it will be responsible for gathering metrics about your system.
In short, here is the final architecture that you are going to build.
III – Installing Prometheus
The complete Prometheus installation for Linux was already covered in one of our previous article.
Make sure to read it extensively to have your Prometheus instance up and running.
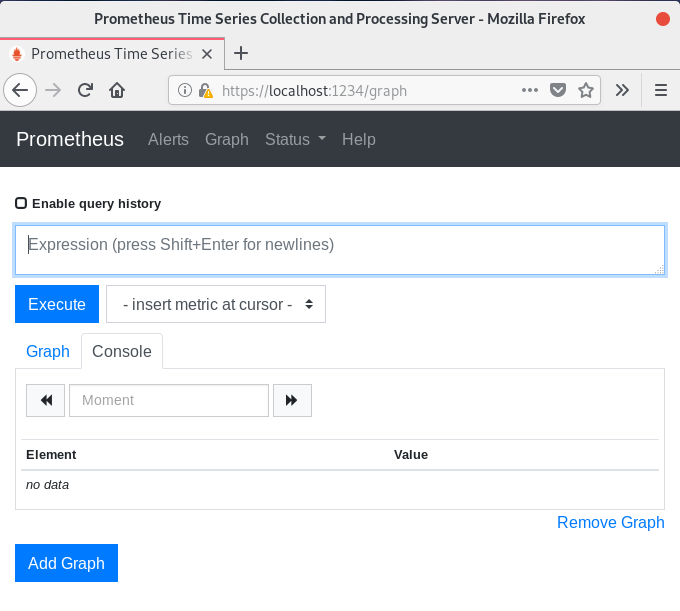
To verify it, head over to http://localhost:9090 (9090 being the default Prometheus port).
You should see a Web Interface similar to this one.
If this is the case, it means that your Prometheus installation was successful.
Great!
Now that your Prometheus is running, let’s install the WMI exporter on your Windows Server.
IV – Installing the WMI Exporter
The WMI exporter is an awesome exporter for Windows Servers.
It will export metrics such as the CPU usage, the memory and the disk I/O usage.
The WMI exporter can also be used to monitor IIS sites and applications, the network interfaces, the services and even the local temperature!
If you want a complete look of everything that the WMI exporter offers, have a look at all the collectors available.
In order to install the WMI exporter, head over to the WMI releases page on GitHub.
a – Downloading the WMI Exporter MSI
As of August 2019, the latest version of the WMI exporter is 0.8.1.
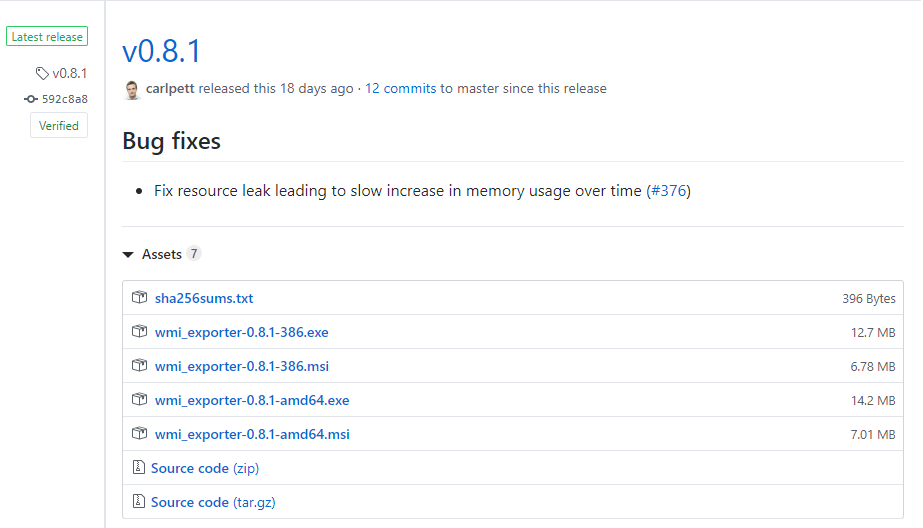
On the releases page, download the MSI file corresponding to your CPU architecture.
In my case, I am going to download the wmi_exporter-0.8.1-amd64.msi file.
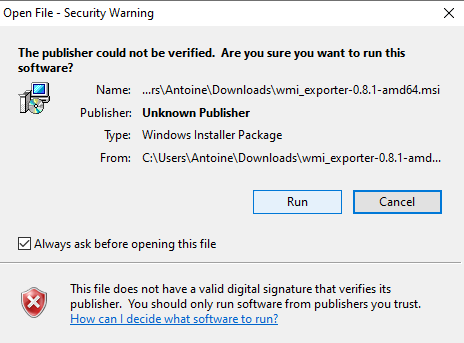
b – Running the WMI installer
When the download is done, simply click on the MSI file and start running the installer.
This is what you should see on your screen.
Windows should now start configuring your WMI exporter.
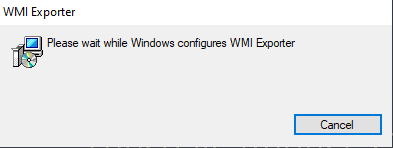
You should be prompted with a firewall exception. Make sure to accept it for the WMI exporter to run properly.
The MSI installation should exit without any confirmation box. However, the WMI exporter should now run as a Windows service on your host.
To verify it, head over to the Services panel of Windows (by typing Services in the Windows search menu).
In the Services panel, search for the “WMI exporter” entry in the list. Make sure that your service is running properly.

c – Observing Windows Server metrics
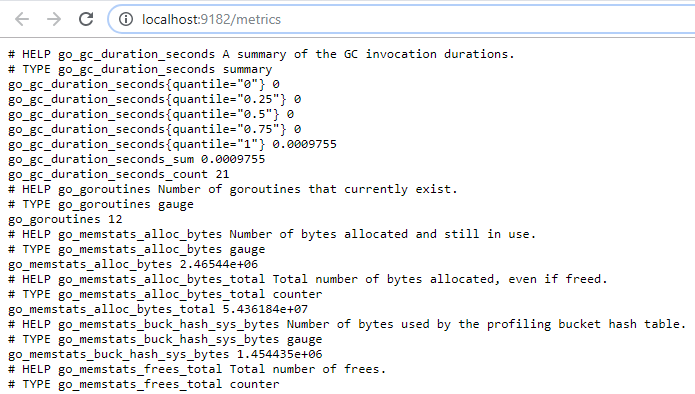
Now that your exporter is running, it should start exposing metrics on http://localhost:9182/metrics
Open your web browser and navigate to the WMI exporter URL. This is what you should see in your web browser.
Some metrics are very general and exported by all the exporters, but some of the metrics are very specific to your Windows host (like the wmi_cpu_core_frequency_mhz metric for example)
Great!
Windows Server monitoring is now active using the WMI exporter.
If you remember correctly, Prometheus scrapes targets.
As a consequence, we have to configure our Windows Server as a Prometheus target.
This is done in Prometheus configuration file.
d – Binding Prometheus to the WMI exporter
As you probably saw from your web browser request, the WMI exporter exports a lot of metrics.
As a consequence, there is a chance that the scrape request times out when trying to get the metrics.
This is why we are going to set a high scrape timeout in our configuration file.
If you want to keep a low scrape timeout, make sure to configure the WMI exporter to export less metrics (by specifying just a few collectors for example).
Head over to your configuration file (mine is located at /etc/prometheus/prometheus.yml) and edit the following changes to your file.
scrape_configs:
# The job name is added as a label `job=<job_name>` to any timeseries scraped from this config.
  - job_name: 'prometheus'

    # Careful, the scrape timeout has to be lower than the scrape interval.
    scrape_interval: 6s
    scrape_timeout: 5s
    static_configs:
            - targets: ['localhost:9090', 'localhost:9216']
Save your file, and restart your Prometheus service.
$ sudo systemctl restart prometheus
$ sudo systemctl status prometheus
Head back to the Prometheus UI, and select the “Targets” tab to make sure that Prometheus is correctly connected to the WMI exporter.
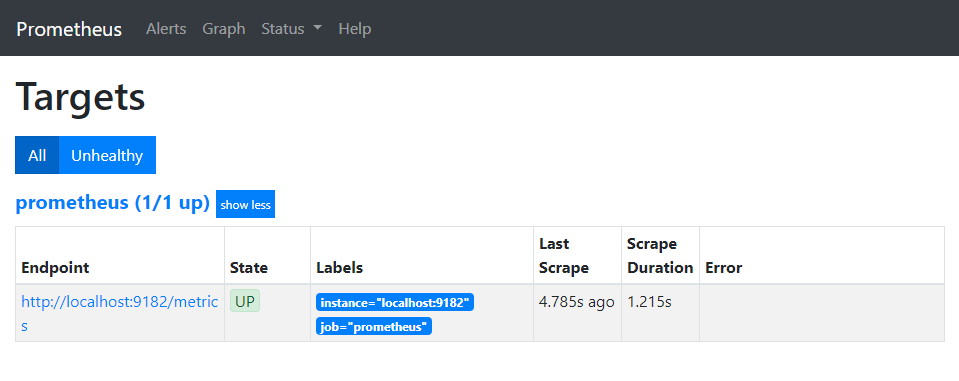
If you are getting the following error, “context deadline exceeded”, make sure that the scrape timeout is set in your configuration file.
Great! Our Windows Server monitoring is almost ready.
Now it is time for us to start building an awesome Grafana dashboard to monitor our Windows Server.
V – Building an Awesome Grafana Dashboard
The Prometheus & Grafana installation was already covered in our previous guides. Make sure to configure your Grafana properly before moving to the next section.
If you are looking to install Grafana on Windows, here is another guide for it.
Prometheus should be configured as a Grafana target, and accessible through your reverse proxy.
a – Importing a Grafana dashboard
In Grafana, you can either create your own dashboards or you can use pre-existing ones that contributors already crafted for you.
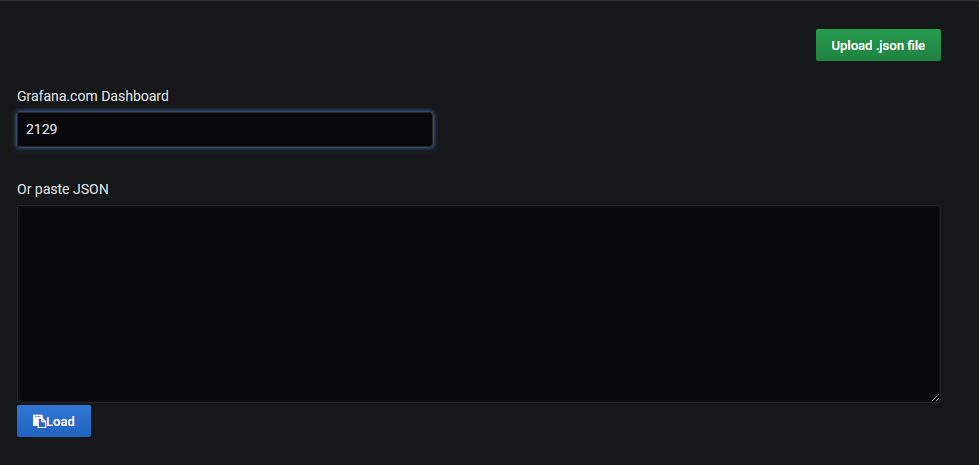
In our case, we are going to use the Windows Node dashboard, accessible via the 2129 ID.
Head over to the main page of Grafana (located at http://localhost:3000 by default), and click on the Import option in the left menu.
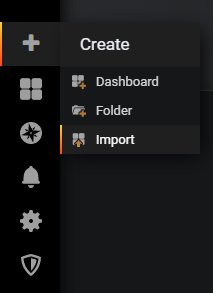
In the next window, simply insert the dashboard ID in the corresponding text field.
From there, Grafana should automatically detect your dashboard as the Windows Node dashboard. This is what you should see.
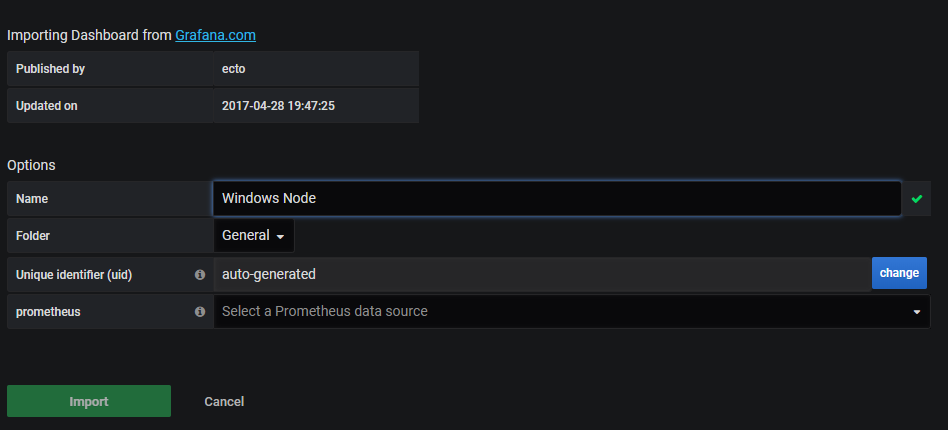
Select your Prometheus datasource in the “Prometheus” dropdown, and click on “Import” for the dashboard to be imported.
Awesome!
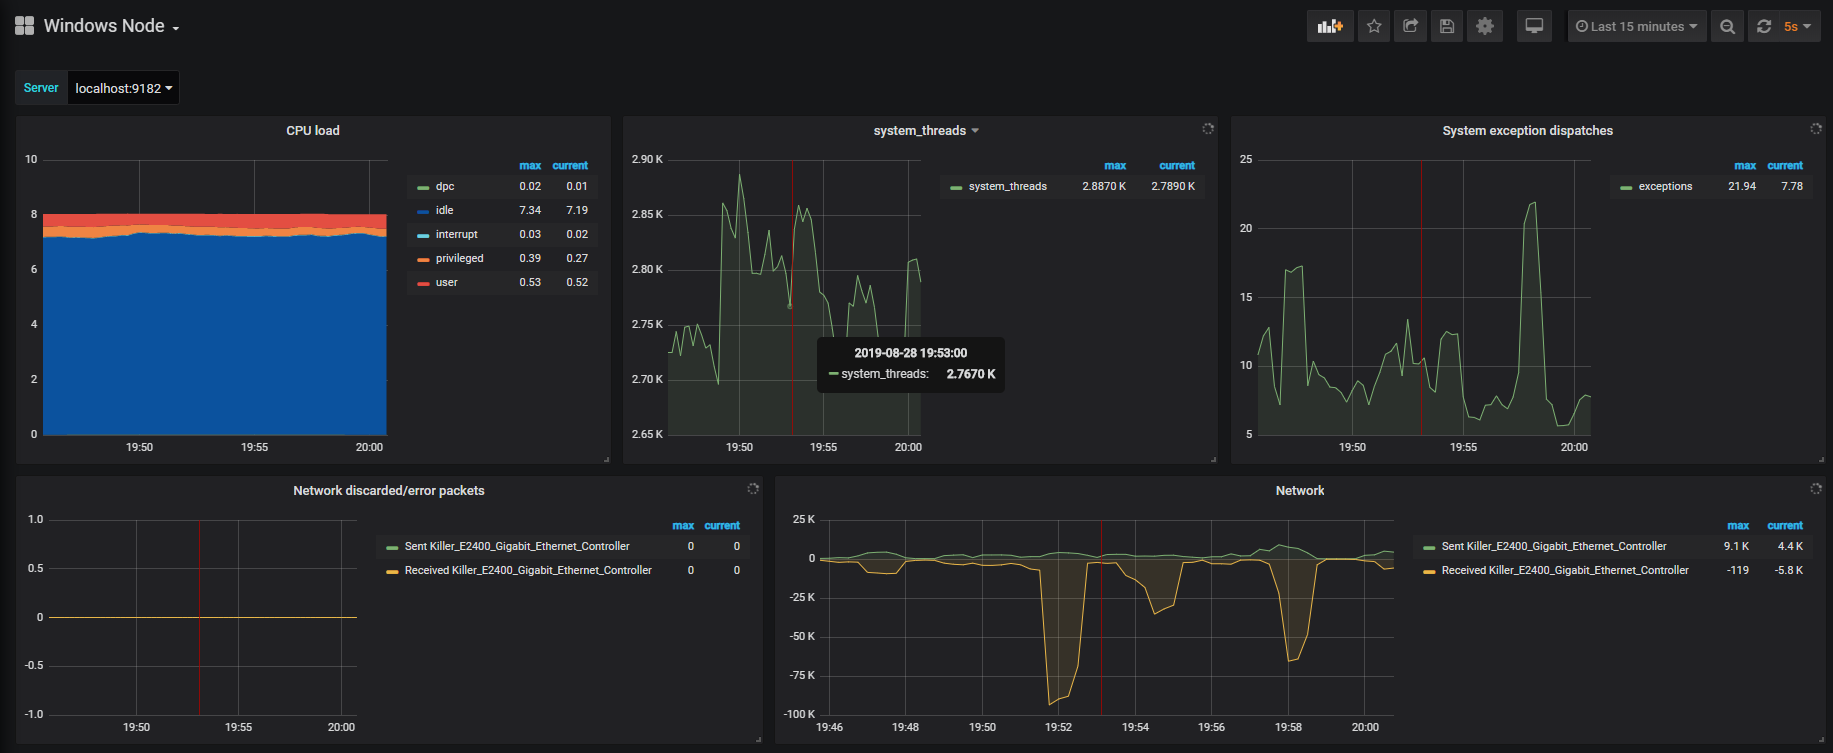
An entire dashboard displaying Windows metrics was created for us in just one click.
As you can see, the dashboard is pretty exhaustive.
You can monitor the current CPU load, but also the number of threads created by the system, and even the number of system exceptions dispatched.
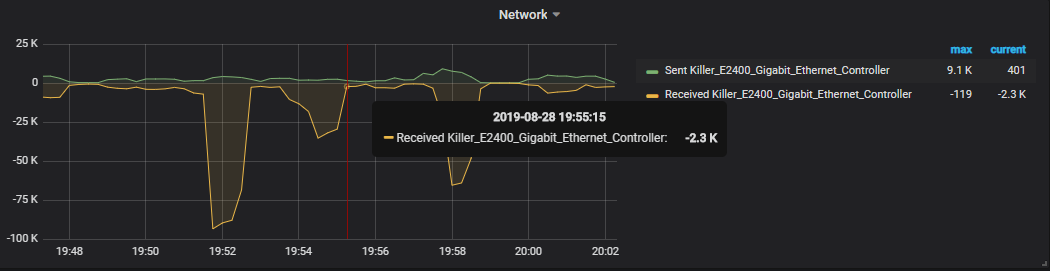
On the second line, you have access to metrics related to the network monitoring. You can for example have a look at the number of packets sent versus the number of packets received by your network card.
It can be useful to track anomalies on your network, in case of TCP flood attacks on your servers for example.
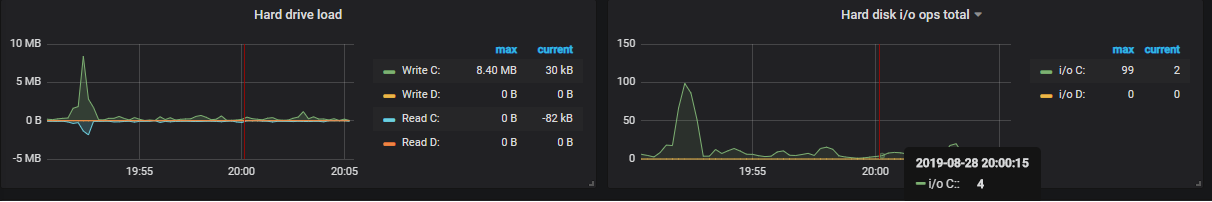
On the third line, you have metrics related to the disk I/O usage on your computer.
Those metrics can be very useful when you are trying to debug applications (for example ASP.NET applications). Using those metrics, you are able to see if your application consume too much memory or too much disk.
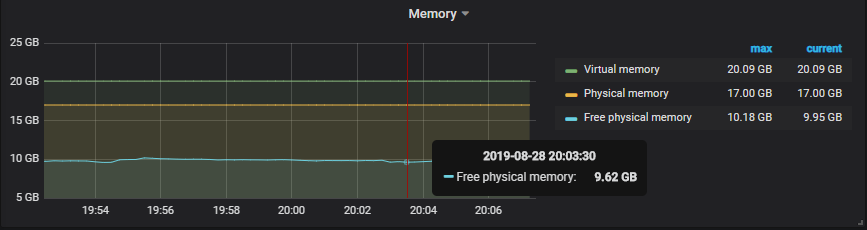
Finally, one of the greatest panels has to be the memory monitoring. RAM has a very big influence on the overall system performance.
As a consequence, it has to be monitored properly, and this is exactly what the fourth line of the dashboard does.
That’s an awesome dashboard, but what if we want to be alerted whenever the CPU usage is too high for example?
Wouldn’t it be useful for our DevOps teams to know about it in order to see what’s causing the outage on the machine?
This is what we are going to do in the next section.
VI – Raising alerts in Grafana on high CPU usage
As discussed in the previous section, you want alerts to be raised when the CPU usage is too high.
Grafana is equipped with an alerting system, meaning that whenever a panel raises an alert it will propagate the alert to “notification channels“.
Notification channels are Slack, your internal mailing system of PagerDuty for example.
In this case, we are going to use Slack as it is a pretty common team productivity tool used in companies.
a – Creating a Slack webhook
For those who are not familiar with Slack, you can create webhooks which are essentially addresses for external sources to reach Slack.
As a consequence, Grafana is going to post the alert to the Webhook address, and it will be displayed in your Slack channel.
To create a Slack webhook, head over to your Slack apps page.
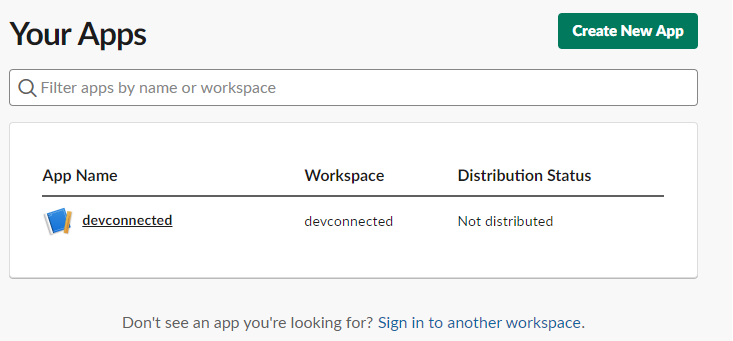
Click on the name of your app (“devconnected” here). On the left menu, click on “Incoming Webhooks”.
On the next page, simply click on “Add New Webhook to Workspace“.
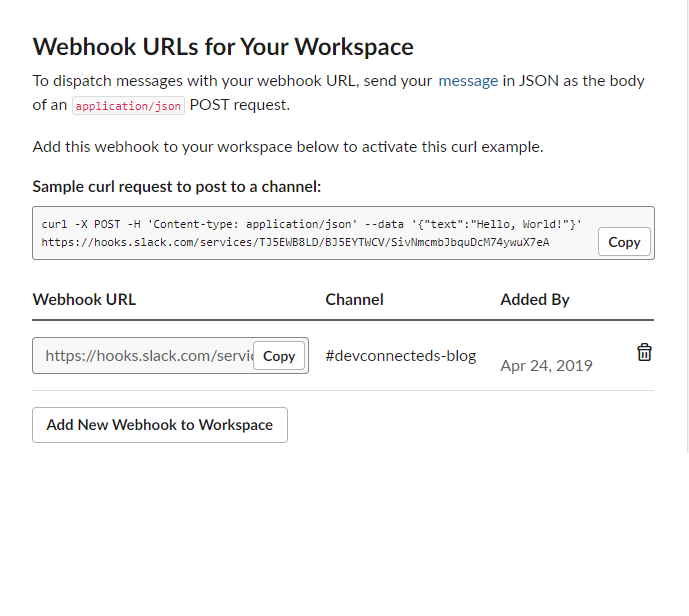
On the next screen, choose where you want your alert messages to be sent. In this case, I will choose the main channel of my Slack account.
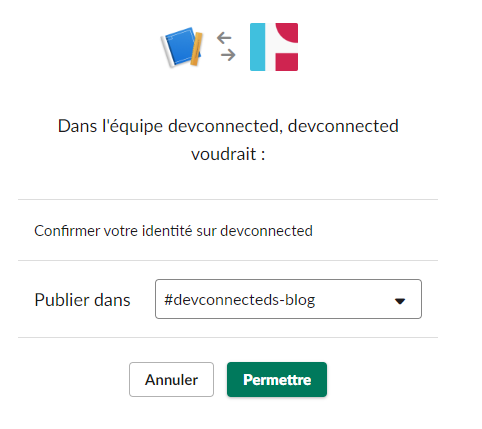
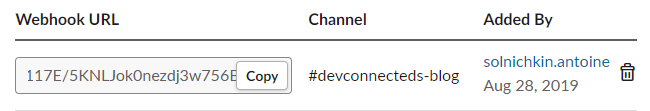
Click on “Allow”. From there, your Slack Webhook URL should be created.
b – Set Slack as a Grafana notification channel
Copy the Webhook URL and head over to the Notifications Channels window of Grafana. This option is located in the left menu.
Click on the option, and you should be redirected to the following window.
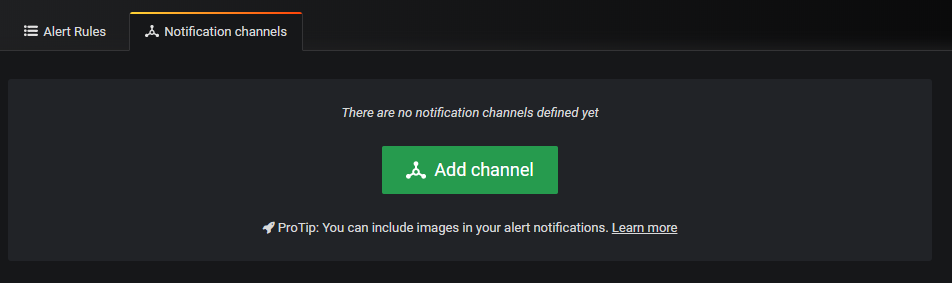
Click on “Add channel”. You should be redirected to the notification channel configuration page.
Copy the following configuration, and change the webhook URL with the one you were provided with in the last step.
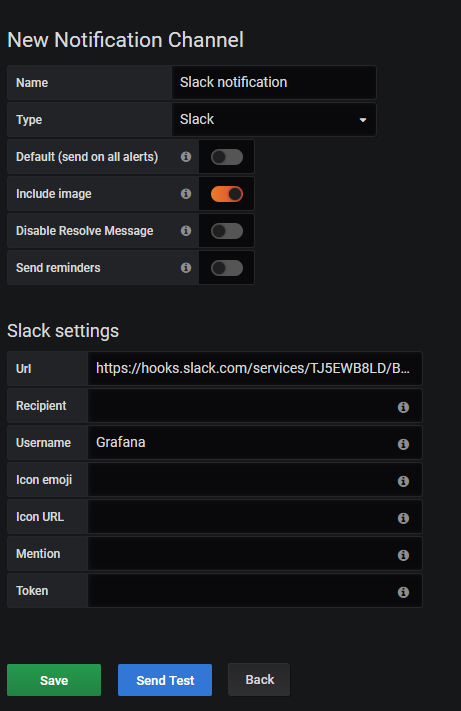
When your configuration is done, simply click on “Send Test” to send a test notification to your Slack channel.
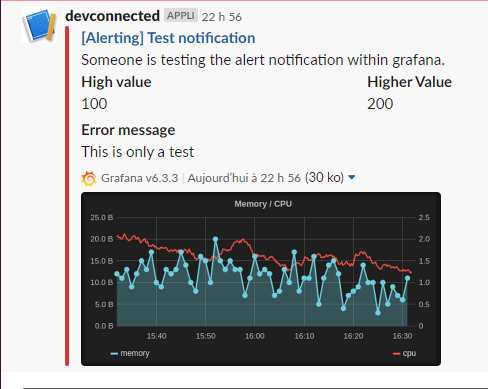
Great! Your notification channel is working properly.
Let’s create a PromQL query to monitor our CPU usage.
c – Building a PromQL query
If you are not familiar with PromQL, there is a section dedicated to this language in my Prometheus monitoring tutorial.
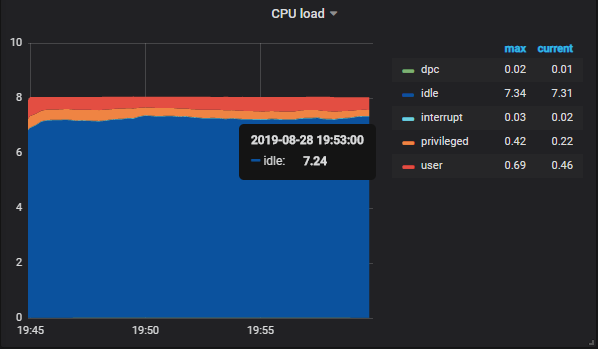
When talking a look at our CPU usage panel, this is the PromQL query used to display the CPU graph.
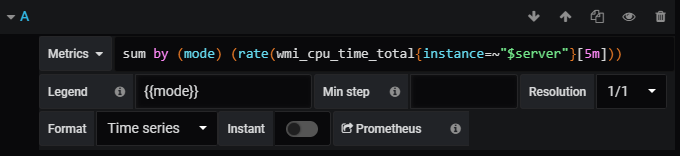
First, the query splits the results by the mode (idle, user, interrupt, dpc, privileged). Then, the query computes the average CPU usage for a five minutes period, for every single mode.
In the end, the modes are displayed with aggregated sums.
In my case, my CPU has 8 cores, so the overall usage sums up to 8 in the graph.
If I want to be notified when my CPU usage peaks at 50%, you essentially want to trigger an alert when the idle state goes below 4 (as 4 cores are going to be fully used).
To monitor our CPU usage, we are going to use this query
sum by (mode) (rate(wmi_cpu_time_total{instance=~"localhost:9182", mode="idle"}[5m]))I am not using a template variable here for the instance as they are not supported by Grafana for the moment.
This query is very similar to the one already implemented in the panel, but it specifies that we specifically want to target the “idle” mode of our CPU.
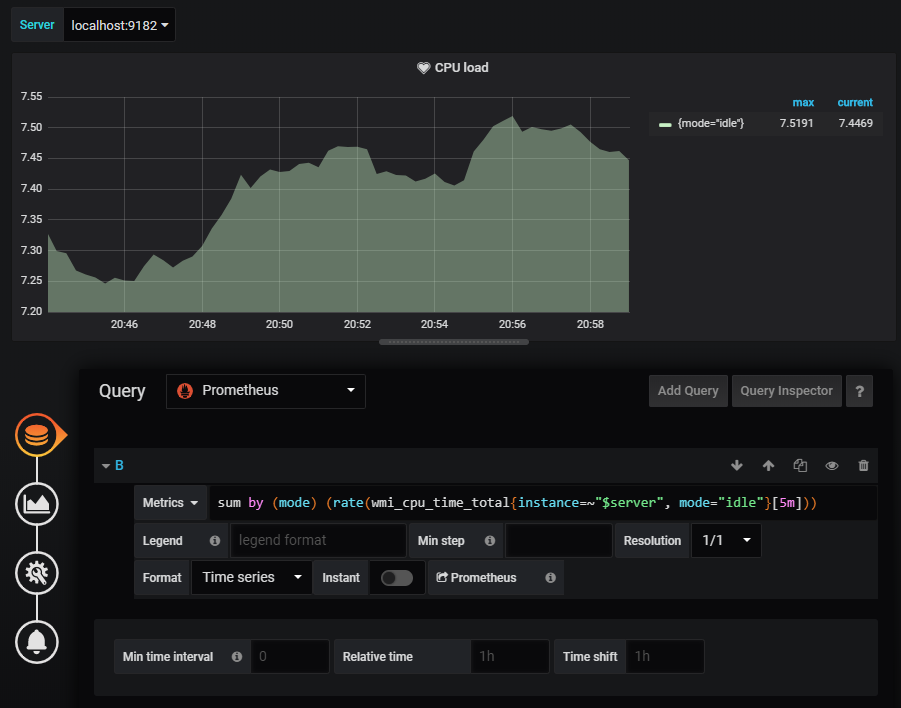
Replace the existing query with the query we just wrote.
This is what you should now have in your dashboard.
Now that your query is all set, let’s build an alert for it.
d – Creating a Grafana alert
In order to create a Grafana alert, click on the bell icon located right under the query panel.
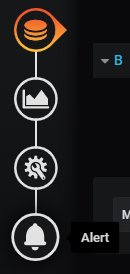
In the rule panel, you are going to configure the following alert.
Every 10 seconds, Grafana will check if the average CPU usage for the last 10 seconds was below 4 (i.e using more than 50% of our CPU).
If it is the case, an alert will be sent to Slack, otherwise nothing happens.
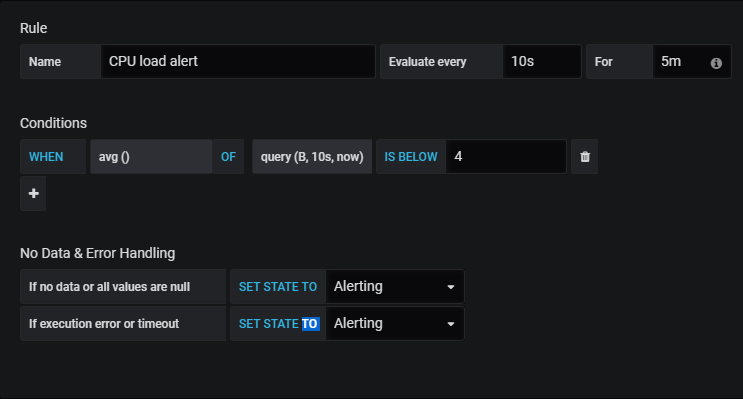
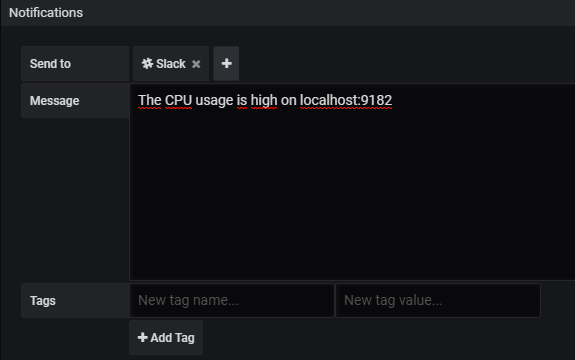
Finally, right below this rule panel, you are going to configure the Slack notification channel.
Now let’s try to bump the CPU usage on our instance.
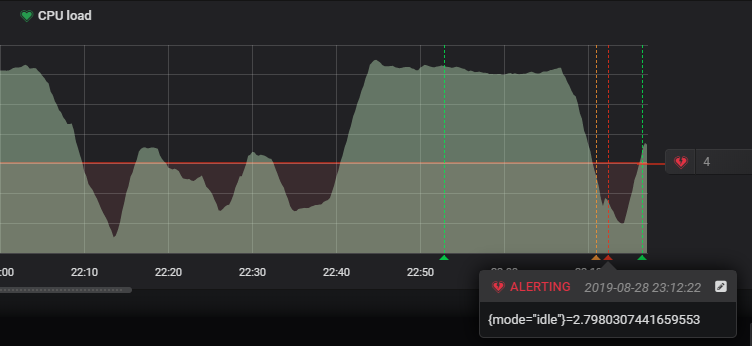
As the CPU usage goes below the 4 threshold, it should set the panel state to “Alerting” (or “Pending” if you specified a “For” option that is too long).
From there, you should receive an alert in Slack.
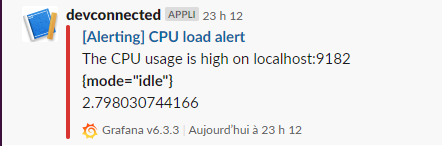
As you can see, there is even an indication of the CPU usage (73% in this case).
Great! Now our DevOps is aware that there is an issue on this server and they can investigate on what’s happening exactly.
VII – Conclusion
As you can see, monitoring Windows servers can easily be done using Prometheus and Grafana.
With this tutorial, you had a quick overview of what’s possible with the WMI exporter. So what’s next?
From there, you can create your own visualizations, your own dashboards and your own alerts.
Our monitoring section contains a lot of examples of what’s possible and you can definitely take some inspiration from some of the dashboards.
On the same subject, make sure to check our Windows services monitoring using Telegraf and InfluxDB.
Until then, have fun, as always.
16 comments
All I get is “cannot read property ‘result’ of undefined”, no metrics are showing?
lets not say easily …
why are u using port 9216 for the wmi exporter? doesnt it use 9182? what a bizarre thing to do.
see my comment below 😉
When I import that same Windows Node dashboard the ‘Server’ dropdown does not get populated with the localhost as seen in your image. How does one target the dashboard to the applicable host please?
2129 is outdated.
You can either fix the JSON by search-and-replacing every “wmi_” with a “windows_” to reflect the current metric names for the windows exporter.
or you just import a more recent dashboard (I found 6593 quite cool)
see my comment below 😉
Everything is working except step D. binding Prometheus.
I was stuck there!
took a while to figure it out but here is a better config:
scrape_configs:
– job_name: ‘prometheus’
scrape_interval: 6s
scrape_timeout: 5s
static_configs:
– targets: [‘localhost:9090’, ‘:9182’]
–> restart prometheus container
So put the IP address of your Windows machine in config file and NOT localhost!!!
this worked for me
I can’t get my Grafana dashboard showing (or receiving) data. I tried several community dashboards. WMI Exporter is running, Prometheus is getting the data, targets are up. But when I import any dashboard in Grafana, always error 404 is returned.
Any hints? Thanks in adavance
Are you using the Grafana UI in order to import your dashboard?
great Post. please note dashboard “2129” is broken and wont work with the updated Windows_Exporter. i uploaded a new dash that i translated from Chinese that is working perfect after following this article.
https://grafana.com/grafana/dashboards/14451.
Hi there!
Excellent tutorial! I’m not sure if I miss something, but the WMI exporter would leave this data exposed, readable without the need for authentication? So it would be protected by firewall rules only, right?
Thanks!
Hi there!
Thanks for the excellent tutorial! One question, once the WMI exporter is running, that information would be published on that HTTP port without any registration need, am I right? It would be protected only if a firewall rule would be customized for it.
Thanks!
Hi there,
Great tutorial! If i may ask, how do you enable IIS collector with wmi exporter. Please assist
2129 does not work. Use 12422 instead Windows Node (fixed for v0.13.0+)
Hi. Thanks first of all. Now, i have deployed the windows exporter to my servers. When i check on a server browser i can see the metrics. But in Prometheus all I get es “Get “http://SERVER:9182/metrics”: dial tcp: lookup SERVER on 127.0.0.53:53: server misbehaving
In my server I have inhabilitated IPv6, but when i try a ping to itsef (as ping localhost) it resolves as ::1, not 127.0.0.1 and i cannot find out why… any help?